Descriptive Statistics in Excel : Hello friends, in this post, we'll discuss that how to Calculate Descriptive Statistics in Excel. This tutorial useful to show data analysis using an MS Excel spreadsheet program. It is used to the analysis of the data that helps describe or summarize data in a meaningful way. If you want to develop complex Statistical analysis then you can save more time by using Analysis ToolPak. Analysis ToolPak is an excel add-in program that provides data analysis tools for financial, Statistical and engineering data analysis.
Data Analysis in Excel 2010
Data Analysis is a process that inspects the data and returns the useful information or summarizes data in a proper manner. Data Analysis functions works on only one worksheet at a time. If you want to use this functions on several worksheets then recalculate for each worksheet.Follow this tutorial to organize a data, use formula and function to calculate Statistical values like mean, standard deviation, standard error or other terms by using MS Excel Analysis ToolPak.
How to Enable Analysis ToolPak in Excel 2010
First check Analysis ToolPak tool is available or not in Excel spreadsheet. If this tool is available for access then click on data analysis in the analysis group in the Data tab. If it is not available in current worksheet then we need to activate Analysis ToolPak. For activating this tool follow some steps:
- First Click on File Tab, click Options then click Add-Ins category.
- In the bottom view the manage option. Here click on the excel Add-Ins from the drop down list then click on Go.
- Some Add-ins available so choose Analysis ToolPak out of multiple ToolPak then click Ok.
- Now Data Analysis option display in the Data Tab.
Steps For Calculating Descriptive Statistics in Excel
Descriptive Statistics means a collection of information or summarize data about the observation that have been made.For calculating Descriptive Statistics in excel follow some steps:
- Click on Data tab then Data analysis from the analysis group.
- Select Descriptive Statistics and click OK.
- Select the input Data range.
- Select Cell for the output.
- Do not forget to click on summary Statistics.
- Then click OK for getting the result.
Hike chart of petrol price in Delhi in last 6 month
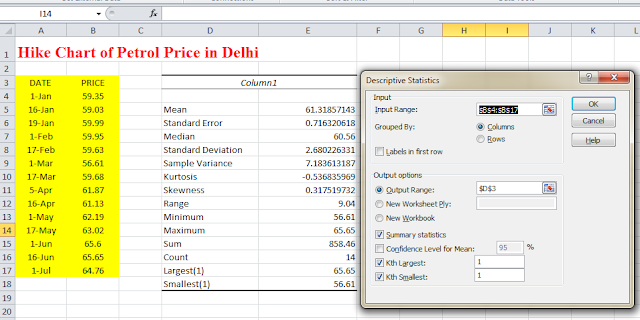
Example: Let we have a Hike chart of petrol price in Delhi in last 6 month and we want to measure some parameters like mean value, standard error value, median, sample variance, kurtosis, skewness, sum, count, minimum value, maximum value or other parameters then we can use Descriptive Statistics functions in MS Excel. Suppose we want to know the minimum and maximum price of the petrol in last six month then this tool is very useful for us.
Conclusion:
Thus, in this post, we explain some necessary steps for enabling Analysis ToolPak in Excel. Here we've focused on how to calculate Descriptive Statistics in excel. If you like this post then you can share with friends, colleagues, and relatives. We'll update the information on a regular basis. Please share this post on facebook, twitter, Google+ or other social media website. If you have any suggestion regarding this post then you can write in the comment section. We'll revert back to you as soon as possible.
No comments:
Post a Comment