Monday 28 January 2013

Business Analytics - The Worst Use of Excel ever ?


Excel is a great tool and I use it a lot.  It's available on almost every business user's desktop and it's highly extensible (with some sensible design) through add-ins and programming but it can't do everything; push it too far and the results can be nasty.  

Here are my nominations for "The Worst Use of Excel ever" awards.

  1. Entire applications built in Excel/VBA.  I'll admit it, I have done this: it's expedient and for prototyping it can work effectively, but the more you try to lock down Excel to behave as an application (rather than a general purpose spreadsheet) the more problems you encounter.  At some point you need to crank up a real programming environment with purpose built components, even if it's only to build an Excel add-in (like XLReportGrids)
  2. Surveys conducted through Excel/Email.   Build a survey template, email it out to 200 folks and get back...junk you can't use unless you manually sift through each response.  (Yes, I know you can try to lock down the survey spreadsheet, but you can't stop stupidity.  People will copy it, change it, enter incomplete records and it will never be a good substitute for direct entry to a database through a form that handles proper validation.)
  3. Trying to join multiple "tables" by extensive use of VLOOKUP functions.  Judicious use of VLOOKUPs actually extends your capability substantially and can help maintain data integrity rather than duplicate data... but, Excel is not a database.  VLOOKUP is very slow compared to a database join and do you really want to check that the right function is defined in every row?   What happens when I need to add a few records?  Can you make sure that the calculation copies down correctly?
  4. Using Excel to edit database tables.  Pull some data from your database into Excel, let someone "edit" it and then try to upload the changes.  It's always particularly (un)helpful if they color-code what changed, added new records or added/deleted a few fields.  
  5. Excel as a project management tool.  I may get some flack from this one as I know it's really popular but it seems to me that Excel is used just as a grid to layout tasks and timelines.  I can do that with a whiteboard.  Typically there is no calculation at all and if you want to tie tasks to resources or visualize slippage in tasks across time, this is not the place to start.
  6. Using Excel's "analytic" capabilities when you need something industrial strength.  I'm not a purist, you can use Excel's Solver and Data-Analysis tools quite effectively for smaller/simpler problems.  As size and complexity increase you may be able to use more sophisticated add-ins but at some point you will need to upgrade to a purpose-built tool to work effectively..
  7. Repeating the same "analysis" or "reporting" once per tab for 40 different brands (or factories or products or managers,...).  Seriously, there is no way you can stop errors creeping in.  You need a reporting or analytic tool that will generate these for you.
  8. Of course there are also the folks that use Excel as a word-processor, a presentation tool or even a grid to hold the numbers they produced on a calculator but that's really not a fault of the system is it?
My own personal favorite for the top spot is #2 at least until I see another example for one of the others :-)  

Which ones resonate for you?  Any other nominations?

Coming soon, a new series of posts around using the "Right Tool for the Job".


Monday 21 January 2013

Recommended Reading: Supply Chain Network Design


I've done a lot of  supply chain network design projects and consider myself to be an expert. Had I had this book from the start, I may have got to expert status a lot faster.

With experience in supply-chain and an academic background that includes mathematical-optimization, when the need arose to build supply chain network optimization models I just did it.  Then I learned many, valuable, real-world lessons the hard way- by getting it wrong.

There are a number of books available that cover this area: I have dipped into a few, as needed, and I have not read most of them so I really can't say this is the best book available on the subject.  I can say this is one of the very few analytic books on any subject that I have read cover to cover.  


Network design is perhaps not as hot a topic now as it was 10 years ago.  That's just my perception, but while the hype right now is around "big data", network design continues to deliver major savings to organizations.  Network design finds where your facilities should be and how product should flow through them to support your business at the lowest cost.  The more rapidly your business is changing the more often this is worthwhile: an acquisition or divestment will almost always justify the expense with a significant ROI.  A 10% reduction in supply chain cost is common..  Even on a stable business there can be significant saving (transportation, labor and warehousing) in adjusting product flow on a relatively frequent, annual basis.

Note that while the authors (all from IBM) have extensive experience building software products to help you do supply-chain network optimization this book is not a sales brochure for LogicNet, in fact, it's barely mentioned.

The math needed to run an optimization model is not simple but it is accessible to those who want to learn and this book does take you through step by step a mathematical programming model that gets increasingly sophisticated.  The necessary theory is all there.

What attracted me was that it goes beyond the theory and has lots of details around project execution:.  the need for sensitivity analysis; the difficulty of getting reliable transportation rates ; sensible data aggregation strategies; why you must have an optimized "baseline"; and numerous others.  These are all areas that analysts get wrong - as I did.  Some learn from the experience, others send out the results anyway.

Managers who hope to become better buyers/consumers of network-design projects (remembering that  your analysts may also be making newbie mistakes) skip the math sections and you can still understand what can be modeled and why you would want to.

For analysts actively involved in building optimization-models the mathematical formulations are extremely helpful. Even if you choose to build models with a software package that tries to hide the harder math from you, the guidance around data and the art of modeling is worth the price and the time to read it.

If you have a network design project in mind and a plane journey coming up - make the investment.  

Supply Chain Network Design: Applying Optimization and Analytics to the Global Supply Chain (FT Press Operations Management) by Michael Watson, Sara Lewis, Peter Cacioppi and Jay Jayaraman (Sep 1, 20112)


Monday 14 January 2013

Ignore SNAP and your product may not be on the shelf when it's most needed - and that means lost sales.


SNAP is the “Supplemental Nutrition Assistance Program” (formerly known as “Food Stamps”) in the United States which puts food on the table for 46 million people every month. 

SNAP can drive big spikes in sales at the store. These spikes are large but short-lived and often pass undetected by reporting and forecasting systems.    

Our whitepaper covers the causes of SNAP spikes, why they vary so much across regions and products, how to identify sales spikes and what you should be doing to maximize sales.

Download it now or visit our website for more information.


Saturday 12 January 2013

Business Combinations: Consolidated Financial Statements


By Jackie, Researcher
Topic: Education
Area of discussion: Financial Accounting and Reporting
Chapter: Business Combinations – Consolidated Financial Statements


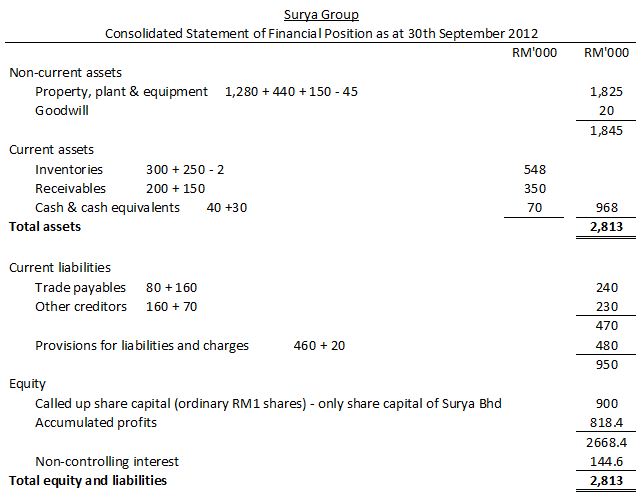
The objective of this posting is to share a worked accounting question which is related to business combinations and consolidated accounts. In this example, clear step-by-step calculations with explanations are provided on: how to calculate the percentage of shareholding, how to compute goodwill, how to incorporate fair value adjustments, how to remove unrealised profit in inventory, how to find group retained earnings, how to compute non-controlling interest and finally, how to prepare consolidated financial statements. I believe this illustration will greatly help students to understand this topic and indirectly provides a solid ground for exam purposes.


Workings with explanations:


1). Percentage of shareholding

The first thing that ought to be done is to find out how much proportion has been acquired by the holding company, if it is not a wholly owned subsidiary. This is crucial as the other proportion may be held by many different shareholders and that kind of ownership is called as non-controlling interest (NCI).


Then, the NCI will be 20%. Always bear in mind that the number of shares used in the calculation of percentage shareholding must consists of voting shares only (i.e. ordinary shares) and not preference shares.


2). Computation of goodwill

Compare the price paid to acquire Cahaya Bhd (i.e. Investments: Shares in group company), with the ‘value’ of Cahaya Bhd at the date it was acquired (i.e. the date of acquisition). Goodwill is the excess of the cost of the investment over the ‘value’ of the proportion of the net assets acquired. Please note that the net assets acquired can be measured either as fixed assets plus net current assets, or as share capital plus reserves.


It is also very important to make clear that pre-acquisition profits are used in the calculation of the goodwill figure (i.e. capitalised), while post-acquisition profits become part of the group profit. Besides, at the date of acquisition the fair values of Cahaya’s property, plant & equipment were agreed as RM150,000 greater than their book values. Thus, a revaluation reserve of RM150,000 will need to be created. Likewise, since the fair values adjustment occurred at the date of acquisition, it will be treated as pre-acquisition and so, it will become part of the goodwill figure. On the other hand, impairment loss has to be deducted from the goodwill figure and charged in the statement of comprehensive income.


3). Necessary adjustment for property, plant & equipment

As Consolidated Statement of Financial Position was prepared at 30 September 2012, we have to sum up both property, plant & equipment owned by Surya Bhd and Cahaya Bhd as at that particular date too. In addition to that, we have to add revaluation surplus of RM150,000 inside that calculation as well, but additional care must be taken because the revaluation surplus was made on 1 October 2009 (i.e. 3 years ago). This mean that additional 3 years of accumulated depreciation has to be taken into account and since Cahaya Bhd has a 10% straight-line depreciation policy, the additional accumulated depreciation for the 3 years period will be RM150,000 x 10% x 3 years = RM45,000.


4). Unrealised profit in inventory

All of the group profit would only be realised, if the holding company which bought goods from subsidiary has subsequently sold all those goods to the third parties (i.e. the outsider). However, for this case, at the end of the year, the goods are not fully sold by the holding company as some goods are still remain in the inventory of Surya Bhd. Then, the amount of unrealised profit must be eliminated.


5). Group retained earnings / Accumulated profits

The retained earnings of the group will comprise the profits of Surya Bhd plus Surya Bhd’s share of profit of Cahaya Bhd which has been earned since acquisition. Adjustments for impairment loss, depreciation and unrealised profit have to be taken into account, if any.


6). Non-controlling interest to be recorded in Consolidated Statement of Comprehensive Income

The non-controlling interest is calculated as 20% of the profit for the year after tax of Cahaya Bhd. This equals: 20% of RM180,000 = RM36,000. We only need to record additional depreciation for one year instead of three because this is not Consolidated Statement of Financial Position. So, remember do not take the accumulated depreciation for 3 years. Meanwhile, unrealised profit needs to be eliminated according to its proportion (i.e 20%).


7). Non-controlling interest to be recorded in Consolidated Statement of Financial Position

Non-controlling interest will be entitled to 20% of the fair value of the company at the date of acquisition. Note: There is no need to divide reserves into pre- and post-acquisition as far as the non-controlling interest is concerned. Non-controlling interest is entitled to share in both pre- and post-acquisition profits. Unlike Consolidated Statement of Comprehensive Income, additional depreciation of 3 years needs to be recorded in Consolidated Statement of Financial Position. Meanwhile, the unrealised profits will have to be deducted according to its proportion (i.e 20%) as usual.


Answers:


Intra-group trading must be eliminated from the consolidated statement of comprehensive income. Therefore, intra-group sales of RM50,000 must be eliminated from both consolidated sales revenue and consolidated cost of sales figure. There are some intra-group goods sold that are still remain in the closing inventory. That unrealised profit must be removed, and this is usually done in practice by increasing the cost of sales figure. Impairment loss of RM8,000 and additional depreciation for one year have been included in the administrative expenses. Investment income is to be removed as it was fully came from dividend paid by Cahaya Bhd: 80% of RM50,000 = RM40,000. Any investment income shown in the consolidated statement of comprehensive income must only be from investments other than in a subsidiary.


Additional readings, related links and references:

This article explains how to prepare basic consolidated financial statements for a group with one subsidiary. It’s the second in a two-part series by the F1 examiner.

Basic rules for preparing a consolidated balance sheet. Good explanations on all treatments and adjustments. Formulas and which items need to be debited or credited are fully displayed here.

Another good exercise with detailed workings and clear explanations done by CIMA, which is good to be viewed by accounting students who are currently studying on this particular chapter.

Preparing simple consolidated financial statements

Preparation of group financial statements – ACCA

Friday 4 January 2013

The New Salesman: Product Knowledge


Product Knowledge – The foundation of selling
In preparation for this discussion, I asked a number of successful distributor salespeople to stop, step back and relive their first days in their territory.  For many of these folks, this was quite a task in and of itself.  Each had a number of things on their minds for the first days of selling.  But, as we pealed back the years; they all said the same thing.  Early on, I had a heck of time deciding exactly what I needed to know.  Even for those who launched their careers based on Engineering (or some other technical) Degrees, being conversant on a whole range of products was daunting.
My next set of conversations took place with a group of highly motivated young sales people who were making great progress but could still be easily referred to as “newbies” in the selling game. One by one, they shared the overwhelming feeling of doubt faced around understanding the tens of thousands of products in the catalogs lining the walls of their office.  In spite of all the reassurances in the world, they wonder if they will ever digest the intricacies of the products they sell. 
At the same time, I still run into sales guys with 2, 3 or even 5 years of experience to tell me they don’t understand their products.  The major difference: this group has given up.  Somehow they have managed to grow their sales.  Often it was price; sometimes via relationships.  But they have managed to convince themselves, they don’t need product knowledge.  This brings us to a couple of good points.
First, the late Zig Ziglar was one of the first superstars of sales training.  I doubt if all of what he said makes sense in the knowledge-based distribution industry; however, I do put a great deal of stock into one of his quotes.  
"Enthusiasm for the product or service comes from product knowledge. How can we develop enthusiasm for something about which we have little or no knowledge?"
Second, as distributors dedicated to producing margins higher than our competitors, we need to provide and prove the value of the solutions we provide.  Unless we can adequately apply our products and services to customer problems, we will never be able to provide solution suggestions. 
So Product Knowledge is important.  The question becomes; what should we do about it?
According to work sited in the best-selling book: Super Freakonomics, expert performers in any profession - whether piano players, computer programmers, rock scientists or salespeople - are made not born.  Mastery arrives based on what Dr. Anders Ericsson calls “deliberate practice”.  Deliberate Practice has three main ingredients:  1. specific goals, 2. immediate feedback, and 3. concentration on technique rather than outcome.
We will lay these thoughts over many of the points we make during our discussion of “on-boarding” but we found an undisputable parallel during our review of the best practices for product knowledge. 
Best Practices for Product Knowledge
  • Distributor sales managers set measurable expectations (goals) for product expertise over a prescribed timeline.
  • The sales managers tested the expertise along the way and provided feedback on the progress of the salesperson.
  • The sales managers asked the new sales guy to apply what they had learned to real life customer situations.

Measurable product expertise goals with timelines
Out of the thousands of products filling the giant stack of catalogs over near the inside sales bullpen, some are important, others no so much.  A new sales person can only guess.  In our time we have heard of salespeople learning products based on alphabetical order, attention from the factory rep, offhand input from other sales people and random chance.  Standing on the sidelines, the whole concept sounds goofy.  But without some kind of expert guidance, how can a new guy understand what’s really important? 
What would happen if you outlined a learning matrix that looked like the one below?
(We have used Lighting Products as an example to illuminate, pun intended, the topic.)
Sample Product Skills Checklist
Month 1
Product
Skills
Incandescent Lighting
10-200 W bulbs
Fundamentals of operation
Catalog selection of office uses
Hours of life
Color rendition
Fluorescent Lighting
13-100 W straight tubes
Fundamentals of operationCatalog selection
Hours of operation
Lighting Principles
All Products
Fundamentals of operationHow hours of operation are measuredLighting output / Lumens
Month 2


LED Lighting
Replacement
Fundamentals of operation
Catalog selection
Month 3


Application
Incandescent, Florescent, LED
Environmental concerns
Lighting output comparisons
Hours of operation comparisons
Relative cost of operation comparisons
  Jumping Ahead
 

Month 12


Lighting layout
Office
Laying out lighting plans for contractor customers
Energy studies
Notice how each month contains products to be learned as well as the level of detail needed for each of these products.  Our example is simplified and limited to just a few examples understood by the general reading population.  Your own set learning guide will include more products and specific skills judged to be important to your own type of customer.

Feedback on product growth
Without an established set of expectations, objective feedback on learning the products is impossible.  Comments like, “you need to learn more about our products” have no meaning.  Building a Skills Checklist with a time line provides an opportunity for the employee to manage their own growth, but the benefits transcend this meager accomplishment.

Along the way, the manager, product specialists, and others can provide meaningful feedback.  For example, following a new product launch, discussions can be held to contrast the new product against products already mastered.  When opportunities present themselves, the new seller can be asked to make presentation (internally focused or customer oriented) on products already mastered.  Definitive coaching points can be provided by way of others on the selling team.

Application of learning
For us, targeting is a critical element of any successful sales program.  More on that in later posts, but for now, let’s talk about how targeting might assist us in refining the new guys selling skills.

As the skills develop, the salesperson can be directed in their abilities to match product knowledge to their customer’s needs.  In each of these cases, the manager is offered the potential for coaching on how the products are applied to solve problems.  Discussions of competitive situations take on new meaning.  The seller’s ability to progress in the selling world accelerates. 
Acceleration is the name of the game 
According to research in a number of lines of distribution, the time required for a new seller to reach maximum potential ranges from 3 to 5 years.  If we can shrink this time, everybody wins.  In our next post we will explore the art of accelerating territory growth one individual at a time.

Distributor Planning Made Easy. Check out our Distributors Annual Planning Workbook:
http://amzn.com/1481196448

Wednesday 2 January 2013

Harvard Referencing Guide

By Admin
Uploaded content: Four pages of brief guide on how to apply Harvard referencing

This quick guide on referencing is very useful to tertiary students especially for those who have just stepped into college or university (for writing reports or doing assignments and researches purposes). Full in-text and end-text referencing formats were demonstrated in detail with relevant examples from different sources. It is highly recommended that if you are using this style of referencing, please download it and adjust the pictures until they can be fitted into A4 papers before you print them. Also, please keep it nicely for future usage purpose.


Page 1 of 4
Page 2 of 4
Page 3 of 4
Page 4 of 4

Better Business Analytics - 2013 New Year's Resolutions


10 resolutions for Better Business Analytics

Firstly - thank you Santa for reading my Christmas list. I love the T-shirt - "Statistics means never having to say you're certain".  With the holiday season coming to a close my thoughts are turning to the New Year and even a certain excitement about getting back to work.  Time for some new year's resolutions !

1. Remember that reporting is NOT analytics

One of the key misunderstandings of analytics in the business world and perhaps part of the reason good analytics is not well recognized for the value it creates is that managers think reporting IS analytics.

Per my previous post "Reporting is about what happened; Analytics is about answering your questions ... well-built Analytics or Predictive Models can find insights and opportunities that you will never find by any other means."

Do good analytics, shout about your success, spread the word.

2. Never, ever build to a manager's spec.

If when you visit your doctor he simply writes the prescriptions you ask for, I suggest you go find a new one, quickly. Unless you possess this expertise yourself, you must rely on your physician to diagnose your symptoms and prescribe action. To do otherwise would be very foolish.

When you (the analytic expert) are asked to build reports or models without explanation as to what it is for - don't do it. Business managers can help you enormously to understand the business context and the killer-questions that need to be answered, but unless they are also skilled in analytics you must bring that expertise to decide how to provide an effective solution.

3. Make sure your project is worth doing

This is really easy and yet so often overlooked. If you are looking for a million-dollar savings opportunity you are unlikely to find it in part of your operation that totals $2 million in cost. However analytically interesting a project may be, business analysts are paid because they generate a good return on investment. Do some simple estimation to see how big an opportunity could be before unpacking the big-guns. See some examples here

4. Use the right tools for the job (or everything looks like a nail)

To recount the old adage: if all you have is a hammer, everything looks like a nail. You must have met people like this, an expert in one particular technological or analytic approach, every single project they undertake is somehow ideally suited for that approach. I've known a few: Excel-experts, database-divas, simulation-specialists, statistics-sages, optimization-??,...

Do you build everything in Excel or in SQL or your favorite BI tool? Are you writing database code in your favorite (non-database) programming language? Has it been a while since you acquired the skill to wield a new tool effectively. Perhaps it's time to extend your skill-set.

5. Learn your craft (or know when to call for an expert)

The difference in skill-level between an analytic-expert and an amateur is huge. In my experience that skill-gap does not result in +10% incremental return on investment, it's the difference between a successful project and a relative failure.

Know when you are getting beyond your skill-level and either set yourself to learning quickly or call in the cavalry.

6. Remember that you are first and foremost in sales/change-management

In all honesty, the "analytics" may be the easy part of business-analytics. Even the most technically-adept analytics fail from a business standpoint unless action is enabled. Knowing that implementation of your project could save 20% in cost may give you a nice warm-fuzzy but unless it is implemented you wasted your time and the company's money. Do that repeatedly and you should brush-up your resume.

To be implemented, a result must be repeatedly and effectively sold-in to an organization. Take the time to present your results as a simple compelling argument for change and deliver that message consistently and often.

Analytics is a lot of fun, but leave a little space for other things in life

7.     Lose that 20 lbs
8.     Exercise more
9.     Eat healthy
10.   Have fun !!

What do you think should be on the list ?


Wishing you an Analytic New Year