Sunday 31 July 2016

Dealing with Renegade Factory Salespeople

In a recent conversation with a very progressive distributor, we touched on an age old topic: the activities of factory salespeople.  To give you a flavor for the call a bit about the distributor. 
 
They are extremely qualified, technically competent and have demonstrated the ability to drive their business forward.  In a time when most distributors in their sector are struggling, their sales are still pushing upward; well ahead of the industry average.  At the highest levels, their supply-partners admire their work, but there is a strange disconnect at the local level.  The local factory sales guys don’t seem to get along with the distributor folks. 

Things get complicated from here.  The distributor, being technically qualified, well trained and totally familiar with their supplier’s products doesn’t need a lot of support.  In a couple of instances, it turns out the distributor team is actually more savvy on the products and applications than the factory sales team.  At a glance, the scenario sounds like the factory salesperson’s dream.  However, friction has developed between the groups. 

The root of the problem...  
The distributor salespeople don’t feel like the factory sellers bring value.  In fact, they believe the factory team slows down the selling process.  On the other hand, the factory guys don’t feel like they are being used properly and see this as a lack of aggressiveness on behalf of the distributor.  Communications suffer and ultimately the disagreement creates problematic “noise” in the relationship.

Complicating the situation, the distributor shares the line with other distributors, which creates some serious repercussions.  Lacking a connection (or sense of appreciation) with my distributor friend, the factory sellers focus their efforts on the other distributor.  In some regards, the factory team actually serves to “prop up” the lesser sales efforts of a weaker competitive distributor.  This happens in a number of ways, but here are a few examples:
·         Most of the factory generated leads go to the competitor.
·         When the factory person “stumbles onto” potential business it is steered to the competitor. 
·         Factory people provide technical services on behalf of the competitor and, thus offset the technology based resources paid for by my distributor friend.
·         Distributor activities reported up the chain of command at the factory paint a picture of aggressive action from the competitor.
·         Negative, or at best, neutral reports are provided back on the better distributor.
·         The response time on pricing required for special commercial situations are slow in coming and most likely questioned more strongly.  This impacts the good distributor’s ability to improve gross margins.

We must understand the whole situation…
Let’s walk a mile in the factory salesperson’s moccasins.  They have a job to do.  And, if my friend’s sales team won’t work with them, they are going to find another outlet; in this particular case – the competitor.  Getting uncharacteristically soft and fuzzy in my comments, they want to be appreciated.  If they feel the love from the competitor and not you, they will help the other guy and (perhaps unconsciously) do harm to your effort and definitely damage your relationship with their management many miles away.

Taking this point a bit further, these factory sellers will work doubly hard to justify their decisions in the field.  It’s a mistake to believe that routine reports and casual conversations with co-workers will not continuously play a narrative of their hard work, customer intimacy and strength in the market.  The customers they choose to introduce to management will be those of the competitive distributor, and probably carry loud messages of why they selected the other guy over you. 

Experience dictates all of this leads to unnecessary and unwanted friction between business partners.  Something needs to be done.  Even if you are right, you still loose.

An action plan….
No message of love and appreciation here, instead think of this as a business plan.  Three basic principles apply; invest, manage and harvest dollars. 

What is the investment?  A little time, some direction, a few compliments and a dash of activity.  Let me hammer out a few ideas:
·         Does the factory guy know on which accounts you are currently?  If they don’t, there is a chance they could inadvertently visit the prospect with the competitive distributor.  This could create a new competitor and might end up with the other guy getting price support which could be used against you.

·         Have you asked the factory guy for leads lately?  The other folks are probably getting the lion’s share of the leads now.  When you ask, promise to communicate results back and involve the factory sales guy in future activities.

·         Set target accounts together.  Assign some responsibilities to the salesperson and some to yourself, keep records and agree to the end results.

·         Schedule joint calls.    While every situation is different, I typically recommend starting off with three days per month.  Spending a day with the salesperson allows you to build a relationship, that’s a good thing.  Further, a day spent with you is a day not spent with the competitor.

·         Arrange for the factory salesperson to handle a few routine issues.  You probably know how to get literature from the factory.  You may even know who to call to get samples, demos and other sales tools.  Assign the action to them.

·         Involve the factory salesperson in lunch and learns, technical presentations and anything else where their presence can be viewed positively.

Now for the managing portion:
·         How can you help the factory salesperson meet their goals?  Get a list of the points on which they are judged.  Don’t expect all of these to be in full alignment with your own goals.  However, understand will help you get more from the vendor sales guy.

·         Keep track of the agreed upon activities.  If the factory salesperson misses a date, doesn’t come through with the promised sample or something else specific, keep a log.  This allows you to provide some level of critique and also understand their weaknesses. 

·         Provide praise, share the thrill of victory.  If they assist, even in a small way, in the capturing of a new account or gathering more business, make it a point to thank them personally.

·         Help them understand the value of working with you.  This comes in the form of periodic reviews of activities and successes.

·         When appropriate, praise them in front of their boss.  Nothing is better than a fat juicy compliment on your work to the big boss man.

The dash of activity:
Find ways to engage and keep them busy.  Remember, a day spent working for you is a day spent not working with the guy across town.  This is so very important, let me repeat.  Consume major portions of their time.

Finally, it is the real world, so let’s cover the two most common scenarios….
Let’s assume the guy is a total jerk and caustic to customers.  Working with him is painful.  Working with him may damage customer relationships.  His boss may or may not know the situation.  Complaining does little to move the needle ahead.  Specific examples allow you to provide feedback without looking like a whiner.  Follow the steps above and in short order, you will have a log of unfortunate instances to discuss.

Fortunately, most times the situation isn’t a complete fiasco.  The guy has some socially redeeming qualities, he just lacks the skills to work in your organization.  While it’s not your job to train factory salespeople, good things could happen.  The guy starts to get the picture and joins your team, leaving the clunky competitor in the dust.  You get an ally and another resource.  Life is good, we all live happily ever after….  Or maybe we just make a little more money, buy a vacation package to Bandera Bay.  Somehow, there aren’t that many unhappy people sipping cool drinks on the beach.


Friday 29 July 2016

How to use Text Functions in Excel

Hello Everyone, Today we'll discuss How to use Text Functions in Excel. Text Functions return an information about a text string and also used to combine a text string and a number together. Excel string Functions have been grouped into various category and today we'll discuss some Text Function Category like Text functions to remove an extra character, Functions to convert excel data type, Function to convert the Text in LOWER case and UPPER case.

How to Use CLEAN Function in Excel

The CLEAN text function is used to remove all non-printable characters from the text. 
Formula used: =CLEAN(text)
Excel Text Functions, Excel Text, Excel mid, Excel Find Function, Excel convert text to number
Here we have some non-printable character in column A and our aim is to remove this non-printable character for that we use the CLEAN function.

Use of TRIM Function in Excel

Trim Text Functions is used to remove extra spaces (except single spaces) between words from text strings.
Formula Used: =TRIM(text)
Excel Text Functions, Excel Text, Excel mid, Excel Find Function, Excel convert text to number
Here we have a text string "Excel sheet 1" with some extra spaces so here we used TRIM function to removes the extra spaces.

How to Create LEFT Function in Excel

If you want to return a certain number of characters from the text string then you can use LEFT functions. Basically, LEFT function returns a specified number of characters from the beginning of the text strings.
Formula used: =LEFT(text,[num_chars])
Note: [num_chars] is set to the default value 1 means return first character of the strings.
Excel Text Functions, Excel Text, Excel mid, Excel Find Function, Excel convert text to number
Here you have a text string "EXCEL TEXT" and you want to first 5 characters of the string then you can use LEFT function to fetch the character from the begging of the text strings.

How to Create RIGHT Function in Excel

If you want to return a certain number of characters from the text string then you can use RIGHT functions and the RIGHT function returns a specified number of characters from the end of the text strings.
Formula used: =RIGHT(text,[num_chars])
Note: [num_chars] is set to the default value 1 means return first character from the end of the text strings.
Excel Text Functions, Excel Text, Excel mid, Excel Find Function, Excel convert text to number
Here you have a text string "EXCEL TEXT" and you want to 7 characters from the end of the text string then you can use RIGHT function to fetch the character from the end of the text strings.

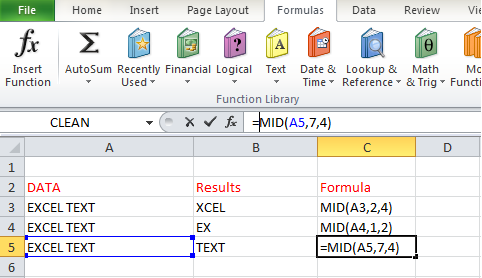
How to Create MID Function in Excel

If you want to return a certain number of characters from the text string then you can also use Excel MID functions and MID function returns a specified number of characters from the MID of the text strings.
Formula used: =MID(text, start_num, [num_chars])
Note: start_num is the integer value that specifies the position of the first character and [num_chars] cannot be blank.
Excel Text Functions, Excel Text, Excel mid, Excel Find Function, Excel convert text to number
Here you have a text string "EXCEL TEXT" and you want to 4 characters from the seventh position of the beginning of the text string then you can use MID function to fetch the character from the specified position of the text strings.

Use of CONCATENATE Function in Excel

CONCATENATE Text Functions is used to combine two or more string together into one combined text strings.
Formula Used: =CONCATENATE(text1," ", text2.........)
NOTE:   " " is used for single space between two text string or word.
Excel Text Functions, Excel Text, Excel mid, Excel Find Function, Excel convert text to number
Here we have a two or more text string in a different location and we want to combine all the strings in a single location then use the CONCATENATE text function like combine AMIT and KUMAR and get AMIT KUMAR in a single cell.

Use of REPT Function in Excel

REPT text function returns specified number of times repeated text string.
Formula used: REPT(text, number_times) 
Note: If number_times is zero then it returns an empty string.
Excel Text Functions, Excel Text, Excel mid, Excel Find Function, Excel convert text to number
This function is used to get the multiple times of text string like we have a text string "ha" in cell A2 and we use the REPT function to get the repeated text strings and see the results in cell C2.

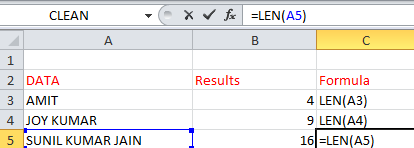
Create LEN Function in Excel

LEN function returns the length or number of character of the text string. 
Formula Used: LEN(text)
Note: Empty string has length zero and a single space also count in the length.
Excel Text Functions, Excel Text, Excel mid, Excel Find Function, Excel convert text to number
This function is used to count the length of the text string like in cell A5 we have a text string "SUNIL KUMAR JAIN" and using the LEN function we find a length of this text string.

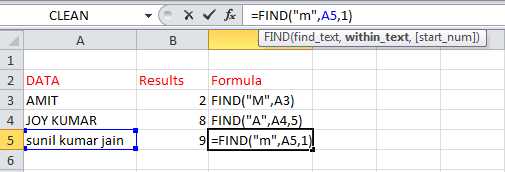
Create FIND Function in Excel

Excel Find function in excel returns the position of a specified character or sub-strings within the text strings.
Fomula Used: =FIND(find_text, within_text, [start_num])
Note: Find Function is a Case-sensitive function.
Excel Text Functions, Excel Text, Excel mid, Excel Find Function, Excel convert text to number
This function basically return the accurate position of the desired character like we want to find "m" character in cell A5 and we can fix the starting position of the text string so this function returns the position of the "m" character.

Use SEARCH Function in Excel

The Search functions in excel return the position of a specified character or sub-strings within the text strings. This function is similar to the FIND function. 
Formula Used: =SEARCH(find_text, within_text, [start_num])
Note: A SEARCH function is not CASE-SENSITIVE function.
Excel Text Functions, Excel Text, Excel mid, Excel Find Function, Excel convert text to number
This function works same as the FIND function but a little difference is that it is not a CASE- SENSITIVE function means if we want to search "M" character in the text string but we have the "m" character in the text string then SEARCH function returns the position of the "m" character. 

Use EXACT Function in Excel

The EXACT function returns TRUE as a result if two strings or value are exactly equal otherwise, returns FALSE if two strings or value do not match.
Formula used: =EXACT(text1, text2)
Note: Exact Function is a Case-Sensitive
Excel Text Functions, Excel Text, Excel mid, Excel Find Function, Excel convert text to number
The EXACT function is used to compare two strings means if the characters of the two different string are same then  it returns TRUE as a result otherwise return FALSE as a result and the main point is that it is a CASE-SENSITIVE function.

Use T Function in Excel

The T function is used to check the supplied value is TEXT or not. If supplied value is TEXT then return the text otherwise, return the empty text strings.
Formula used: =T(Supplied value)
Excel Text Functions, Excel Text, Excel mid, Excel Find Function, Excel convert text to number
The T function is a very simple function, it check the text string either the string is text or not. If the input string is text like "AMIT" then T function return "AMIT" as a result while if the input string is any other format like value "0.5" then T function returns an empty string.


Create REPLACE Function in Excel

The REPLACE function is used to replace the text string with another string. You can also replace the part of the text strings with another part of the strings.
Formula used: =REPLACE(old_text, start_num, num-chars, new_text)
Note: The old_text is the text string that you want to replace and start_num is the position of the first character within old_text and num_chars is the number of character to replace and new_text is replacement string or part of the string.
Excel Text Functions, Excel Text, Excel mid, Excel Find Function, Excel convert text to number
This function is used to replace the text string or part of the text with another text. Here we are 4 parameters to use this function. First is old text like "KUMAR" , second is start_num means the position of the first character of "KUMAR", third is num_chars means number of character in text "KUMAR", and finally fourth is new_text like "SINGH". 

Create SUBSTITUTE Function in Excel

The SUBSTITUTE function replaces one or more instances of a text string within an original text string. This function is similar to the REPLACE function.
Formula used: =SUBSTITUTE(text, old_text, new_text, instance_num)
Note: This function is a CASE- SENSITIVE. 
Excel Text Functions, Excel Text, Excel mid, Excel Find Function, Excel convert text to number
The working of this function is same as the REPLACE function but the difference is that it replaces the instances of the text string and also the CASE-SENSITIVE function. In cell A4 the instance "an" is replaced by "A".

How to Create UPPER Function in Excel

The UPPER function is used to convert all the characters of the supplied string in the UPPER case. 
Formula used:  =UPPER(text)
Excel Text Functions, Excel Text, Excel mid, Excel Find Function, Excel convert text to number
This function convert all characters in UPPER case like we have a text string "excEL" and we apply the UPPER function then this function changes all the character in the UPPER case.

How to Create LOWER Function in excel

The LOWER function is used to convert all the characters of the input string in the LOWER case.
Formula used:  =LOWER(text)
Excel Text Functions, Excel Text, Excel mid, Excel Find Function, Excel convert text to number
This function convert all characters in LOWER case like we have a text string "excEL" and we apply the LOWER function then this function changes all the character in the LOWER case.

How to Create PROPER Function in Excel

The PROPER function is used to convert all the characters of the supplied string in the proper case means to arrange the string in the UPPER case and LOWER case.
Formula used: =PROPER(text)
NOTE: The first The first character of the every word is converted in the UPPER case by the PROPER function.
Excel Text Functions, Excel Text, Excel mid, Excel Find Function, Excel convert text to number
This function is the combination of the UPPER and LOWER function. As the name suggest this function convert the text string in the proper manner and the first character of every word convert in UPPER case like "excEL shEEt" change in the proper format as "Excel Sheet".

Use CHAR Function in Excel

The CHAR function returns the character according to an input character set number from 1 to 255 and outcomes get from the ANSI character set.
Formula used: =CHAR(number)
Note: (1) The character set may vary in the different computer system so the result can also vary in the different computer.
(2) You can also get #VALUE! error from the CHAR function. It occurs when the input number is outside of the range 1 to 255.
Excel Text Functions, Excel Text, Excel mid, Excel Find Function, Excel convert text to number
This function is used to get the character corresponding to the number according to the ANSI character set like we enter the number 63 in cell A2 and apply the CHAR function so get the character corresponding to the number "?".

Use CODE Function in Excel

The CODE function converts the first character of the input text string into the associated numeric set code. The outcomes of the CODE Function get from the ANSI character set.
Formula used:  =CODE(text)
NOTE: Return code may vary across the different operating system.
Excel Text Functions, Excel Text, Excel mid, Excel Find Function, Excel convert text to number
This function is opposite to the CHAR function means returns the numeric code corresponding to the first character of the text string like we have a text string "Excel" then by using the CODE function we get the numeric code of the first character "E". 


Create DOLLAR Function in Excel

The DOLLAR function converts an input number to a specified number of decimal places and we can also change the currency format by the DOLLAR function.
Formula used:  =DOLLOR(number,[decimals])
Excel Text Functions, Excel Text, Excel mid, Excel Find Function, Excel convert text to number
This function is used to convert a text string into another currency format like we have a data in the Indian currency then we can change the data in the USA currency like cell A2 have the string "125" in tIndianian currency and convert it into USA currency "$125".

Create FIXED Function in Excel

The FIXED Function converts a supplied number to a specified number of decimal places and then convert into a text.
Formula used: =FIXED(number,[decimals], [no_commas])
Note: (1)Number indicate the input number.
          (2)[decimals] specifies the number of decimal places that display after the decimal point.
        (3) [no_commas] specifies the return text should separate thousands by the comma. It has two                  value either TRUE or FALSE. TRUE means commas are not included in the resulting text                    while FALSE means commas are included in the resulting string.
Excel Text Functions, Excel Text, Excel mid, Excel Find Function, Excel convert text to number
This function is basically used to convert a number to a proper format means we can manipulate the  number to the desired decimal places and we can also include the comma in the number like in cell A5 we have "11999.99" and apply the FIXED function with the left 2 position of the decimal places and no_commas is TRUE then get the Result "12000"

Create TEXT Function in Excel

The TEXT function is used to convert a numeric value to text according to the user defined format.
Formula used: =TEXT(value, Format_text)
Excel Text Functions, Excel Text, Excel mid, Excel Find Function, Excel convert text to number
Here the text function returns the proper format of the input text string like in cell A4 we have the text string "0.125" and by using this function we get the proper format of this string as "12.50%".

Create BAHTTEXT Function in Excel

The BAHTTEXT function is used to convert a number into Thai text and adds a suffix "Baht".
Formula used: =BAHTTEXT(number)
Excel Text Functions, Excel Text, Excel mid, Excel Find Function, Excel convert text to number
The BAHTTEXT function simply convert any text into Thai Text like we can see above.

Use VALUE Function in Excel

The VALUE function is to convert a supplied text string into a numeric value.
Formula used: =VALUE(text)
Excel Text Functions, Excel Text, Excel mid, Excel Find Function, Excel convert text to number
Here the Excel convert text to a Number by using this function like in Cell A4 we have the string "1.00E-02" and convert it into numeric value as "0.01".


Conclusion:
Thus, in this post, you will find How to Use Excel Text Functions. As we all know Text function is very helpful to convert any text string into the particular format as we want. If you like this post then you can share with friends, colleagues, and relatives. We'll update this information on the regular basis. You can also share this post on facebook, twitter, Google+ or other social media website. We hope that you like this post. If you have any query regarding this post you can freely write in the comment section. We'll revert back to you.

Thursday 28 July 2016

Comparison between SAS, R and SPSS (Differences between SAS, R and SPSS)


Guys, I did spent quality time to understand the differences between SAS, R and SPSS, I know R very well, SAS a bit, from which I  somehow understood where R is better, Where  SAS is. I tried to put that in comprehensive way here for you. Fortunately I found some info graphics in internet which exactly reads about the information that we all are looking for.


Here you can find...


I would recommend you to notice R growth in terms of employment and popularity. Yes we all have to encourage and use open source technologies. I personally recommend you guys not to depend much on frame works that have always limitation, you can't travel beyond those hurdles. Its all ways better to have free hand to create what ever we aim to and that can be done using languages that open source.


Know About Revolution Programming Language in Statistics (R - Language)


R is a programming language and software environment for statistical computing and graphics supported by the R Foundation for Statistical Computing. Creators of R are Mr. Ross Ihaka and Mr. Robert Gentleman studied and invented at University of Aukland, New Zealand.  R is derived from S programming Language. 

Besides R environment supports following amazing concepts..
  • an effective data handling and storage facility,
  • a suite of operators for calculations on arrays, in particular matrices,
  • a large, coherent, integrated collection of intermediate tools for data analysis,
  • graphical facilities for data analysis and display either directly at the computer or on hardcopy, and
  • a well developed, simple and effective programming language (called ‘S’) which includes conditionals, loops, user defined recursive functions and input and output facilities. (Indeed most of the system supplied functions are themselves written in the S language.)
The term “environment” is intended to characterize it as a fully planned and coherent system, rather than an incremental accretion of very specific and inflexible tools, as is frequently the case with other data analysis software.


R is very much a vehicle for newly developing methods of interactive data analysis. It has developed rapidly, and has been extended by a large collection of packages. However, most programs written in R are essentially ephemeral, written for a single piece of data analysis.

You can also watch videos followed by..

A Funny for the CRM Haters


An engineering funny that had me laughing a bit more than necessary.  Tomorrow is Friday.  A great time to catch up on paperwork, follow up on calls, and check in with your favorite bloggers.  I'll be honest, my last post concerning CRMs was not well received.  I have a feeling so many of you just hate the THOUGHT of a CRM that you didn't even read the article!  Trust me, if you are a hater, and I can't say I have always loved them, there is something useful for you as well.  Brian Gardner knows what he's talking about!  That being said, I happen to love a little controversy.  Send me your hate mail concerning CRMs as I think this point needs some attention as well!  As usual, you will get a postcard from Iowa for submitting your idea!

How to Create a Histogram in Excel

Hello Everyone, Today You'll find How to Create a Histogram in Excel. A histogram is a tool of Analysis ToolPak in MS Excel. It is used to represent the data in the graphical form and use the column chart to display frequency data . To create a Histogram in excel you need to organize the data into two column. You can easily analyze the data using the histogram tool in the MS Excel. In this tutorials, you will find the method to use the histogram and create a chart by using it.

How to Enable a Histogram using Analysis ToolPak

A histogram is a column chart that visualizes how to make the frequency excel data represent in two column on the spreadsheet. The first column represents the input data and the second column represents the bin numbers. Input data is the data that you want to analyze and bin numbers are the data intervals on that you want to apply histogram tool for measuring and analyze the data. For use the histogram first you need to install Analysis ToolPak in your worksheet. To enable Analysis ToolPak click here

Creating a Histogram in Excel

For creating a Histogram in MS Excel worksheet first, you need to enter the particular data into two columns so make an excel worksheet with two columns data.
Create a Histogram in excel, histogram excel, histogram chart, frequency excel
After entering the data on the worksheet you need to follow some steps to use the Histogram tool as:
  • On Data tab, Click Data Analysis.
  • Data Analysis Dialog box appears, Select Histogram and Click OK.
Create a Histogram in excel, histogram excel, histogram chart, frequency excel
  • Then select the input range and bin range in the Dialog box.
  • Click new workbook and select the chart output check box then Click OK.
  • Get the result below.
Create a Histogram in excel, histogram excel, histogram chart, frequency excel

Customize and Improve Excel Histogram

We create a Histogram using the Analysis ToolPak and many excel functions. But it is also important to better visualization of your Histogram. We have another tutorial to modify the chart according to the requirement. For that, you can click here.

Remove Spacing between Bars

When you make a histogram, you want to an adjacent column in your Histogram chart without any gaps. To remove extra spaces between bars you can follow some steps as :
  • Double-Click on the column of the  Histogram chart.
  • Click on the Format Data Series.
  • On the Format Data Series, set the Gap width to zero.
  • Get the Result.
Create a Histogram in excel, histogram excel, histogram chart, frequency excel


Conclusion
Thus, in this post, you will learn how to create a Histogram chart in excel. We use the frequency function to create a Histogram in excel that returns the value that falls within the specified range (called bins). If you like this article then you can share with your friends and colleagues. We hope you will like this article and we'll update the information on the regular basis. You can also share on social media websites like facebook, twitter, and Instagram. If you have any query regarding this post then you can freely write your query in the comment section. We'll revert back to you as soon as possible. 

Monday 25 July 2016

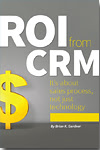
Getting a higher ROI from your CRM

Thinking about Money?
Thinking about Sales Process?
Thinking about CRM?
(A Book Review)
Talking to distributors, we have discovered that many of them have made big investments in Customer Relationship Management (CRM) Systems.  Many of them have pushed their salespeople to track customer contacts and enter opportunities.  Candid conversations reveal, however, that the vast majority still feel like they are not getting their money’s worth from their CRM system.  This brings us to the subject of this post: a book by SalesProcess 360’s Brian Gardner.

Brian brings a wealth of information to the topic.  He has decades of industrial sales experience.  He worked as a salesperson, sales manager and as a software developer.  Make no mistake, this book isn’t a 100 page advertisement for some software platform.  Instead, it’s about sales process and applying technology to automate the sales process.

Mr. Gardner reverses the process most distributors use to select their CRM system.  While many would simply create a technology checklist, which includes the items listed below, Gardner goes a step further and lays out a plan for objectively examining realities of your sales group.  This, of course, allows for overall process improvement.


Technical Checklist typically tied to CRM System Selection
·         User friendliness of the screens
·         Ability to link with Outlook
·         Web-based platform so salespeople can log in from the road
·         Managers ability to review opportunities in the system
·         Easy to get reports
·         Email broadcast capability
·         Mobile capacity

Further, the author lays out a plan for reviewing existing sales procedures to determine how the CRM system might be better used.  Using what he refers to as the “SalesProcess360 CRM Audit,” he directs the reader through a step-by-step analytic of their sales team’s operation in their native environment.  A sampling of the kinds of questions asked are provided (with permission) below. 

Sample Questions from the Sales Process Review
·         Are outside and inside salespeople teamed up?
·         Do you have products specialists?  What is their focus?
·         When a new outside salesperson is hired, what does their getting-started programs look like?
·         What are your sources for leads?
·         Are you doing opportunity management?  What is your definition of a lead?
·         What is the estimated number of quotes done per day by the company?  By person?

The end result is a CRM Roadmap Matrix which assists the leader in selecting the best pieces of the business for CRM based automation.

The book lives up to it's title: “ROI from CRM: It’s about sales process not just technology."  Gardner goes on to build a plan for measuring what a company might expect to garner from deploying the right system.  To me, this is the real meat and potatoes of the exercise.  For distributors fighting to build on their bottom line, the book provides valuable feedback on the real reason for employing both CRM and a sales process; increased revenue. 

From my perspective, distributors need to see and measure the ROI of employing a better sales effort.  Like everything in our business model, there has to be a payback for our actions (and cash outlays.)  Distributors don’t provide world class customer service for the bragging rights, we do it because it attracts profitable business.  We don’t spend nearly 60% of our gross margin hiring the very best people to look flashy, we do it because great people create better results.  The same analogy can be made with inventory, efficient warehouses, or top flight computer systems; we do it because there is a return on our investment.   The clearer the cause and effect picture, the more dedicated we become to putting the tools to good use.

Extending beyond all of this, the book outlines a plan for implementing your CRM system once you determine the right path to follow.  Better yet, the implementation plan is designed to help you harvest the low hanging fruit first – reinforcing the whole ROI idea.  The plan steers expectations; including some of the inevitable pushback from those who will resist even the slightest change.

Since this is a book review here are a few other interesting points

The book is written in a conversational tone.  It’s an easy and enjoyable read.  I started reading it on a flight from Minneapolis to the West Coast and finished it somewhere over Colorado on the way back.  Along the way, I took copious notes and made a number of points to share with colleagues and clients.

The book contains links to at least a dozen worksheets, spreadsheets and other supporting data.  This is worth the price of admission in its own right.

Brian Gardner knows what he’s talking about and it shows.  I would absolutely recommend anyone thinking about implementing a CRM system or just thinking about how process might work in their sales department to pick up a copy. 

You can buy your copy from Modern Distributor Management.

Post Script One:  Thinking back on this book, I see plenty of information which could help a struggling distributor “re-launch” their current CRM System to drive better payback.

Post Script Two:  If you have a book that you feel would be of value to colleagues on the front lines of Wholesale Distribution, we are open to your suggestions to the group. 


Tuesday 19 July 2016

The Life and Times of an Elephant Hunter

Last week I had the opportunity to meet a real live Elephant Hunter. No, not the African Safari kind, this elephant hunter
was of the sales variety. After years of bouncing from manufacturer to distributor and back, he called me to help him find his next opportunity. During the normal introductory niceties, (contrary to my wife’s opinion, I am a nice guy,) he boasted about a dozen or so really big deals he had singlehandedly managed during his two decade career. Make no mistake, this made an impressive list. I was buying into his story hook line and sinker. Until, we reached the point where I asked him, why he was looking for a new opportunity.

For some reason he didn’t share upfront, he was currently “between jobs.” With this impressive list, one would wonder how such a rain-maker could possibly be out of work. I know lots of sales organizations and very few willingly separate ways with someone who can really bring in business. It made me scratch my head. I asked him about it and the answer was shocking, he said my last couple of deals didn’t come through and my business dropped off substantially.

For distributors in his industry, business can be divided into “project” business and flow business. Even during the darkest hours of the Great Recession, the flow business for most customers continued to roll in. The ratio for a healthy end-user customer looks something like 70 percent flow and 30 percent project. Things look slightly different for OEM customers, but even there most have some flow business remaining.

About fifteen minutes into the conversation, I explained my thoughts on flow business and asked if I was missing something. After a long pause, I heard a reluctant story of no time to build a solid foundation of long term repeat business. This guy prided himself on bringing every resource possible toward capturing the big deal. He felt pursuing what he termed as “piddle” routine stuff was better left for those small minded types who couldn’t hunt the elephants.


The truth about our kind of selling
One of the issues I have with many of the generic off-the-shelf sales training courses comes from the backgrounds of the instructors. Many industries thrive on “one time” sales. The sale is an event rather than a process. For distributors, it works differently. Our sales strategy is a continuous string of discovering customer needs, proposing a solution, assisting with implementation of the solution and repeating the process. Over the years, we develop customer trust, build loyalty and grow our flow. We strive for what some call “customer wallet share.” When things go well, our ongoing actions entice the customer to purchase more from us because they know we desire the orders.

Capturing projects has a place in our world, but only after we have built a solid groundwork of customer knowledge, relationship and trust. Chasing projects which just happen to come floating across our desks is often an exercise in futility. We waste our time and resources developing complex quotes for business with little chance of success. Further, negotiation experts like Anthony Perzow of SPASigma indicate some of our quotations are simply used as rabbits to drive down the price of the guy the customer really wants to buy from. The rabbit has zero chance of closing the order. In a day when most distributors are fighting to channel resources, time spins down the drain.

What should we be doing?
Targeting the right customer list for our efforts makes sense.
Building a relationship and trust takes time. If we spend our time on customers with little potential, the payoff never comes.
Asking the right questions and gathering customer data pays off as well. Nothing accentuates our relationship with a customer like understanding their business. The more we know about the customer’s unique situation, the better our chances of providing valuable solutions.

Understanding our competitors on an account by account basis helps us better position ourselves. We must recognize why the customer buys from others. This is especially important if you “split” the business with several competitive distributors at an account.

Harnessing the efforts of our supply-partners builds our portfolio of business. Very few distributors enjoy exclusive supplier relationships. Protecting business against cross-channel conflicts preserves our margins and frees supply-partners salespeople to work directly in building your position at the customer.

Focus, but don’t be an elephant hunter…
It’s our job to capture as much business from our territory as possible. I believe focus is important. For most distributor salespeople, this means focusing in on 30-40 accounts. Elephant hunters want a list of 200 accounts so they can search for the jumbo sized orders as they appear. Working to create a relationship with 30 or so accounts gives you time to develop the relationship, grow the flow and when the elephant appears take it down in the normal course of business.

What happened to my newly found elephant hunting friend? I am not sure any of this advice sunk in. His last words were something to the effect of... “When the economy picks up, the big orders will come back and I will be there.” I only hope he has enough money to survive in the meantime.  I have a feeling he'll be singing the old Hoyt Axton song "Where did the money go?"

Thursday 14 July 2016

How to Create a Chart in Excel | Graph in Excel

How to Create a Chart in Excel: Hello everyone, Today we'll discuss how to Create a Chart or Graph in Excel. A chart is a tool to show the data graphically. It is used to show the series of data in a graphical format to understand the large quantity of data and it is necessary to make a Graph if anyone wants to analyze the data for submitting the business report. Excel sheet have lots of Chart or Graph and each chart has its own advantage. As we all know that excel worksheet contains a lot of data so it is difficult to interpret a large amount of data. Here we'll explain various types of chart or Graph with the various set of data and apply some changes on the Graph.

Create a Chart or Graph 

To find highest and lowest value, increase and decrease number are very easy when the data is represented as a Chart in excel. You can create a chart to easy access of the data at a glance. Here we'll discuss some point about a chart so to create an Excel Graph follow some steps as:
  • Select the source data of the chart or select row and columns cells.
  • Click Insert tab.
  • In the chart group, select the desired chart category.
  • Select the desired chart type from the Drop-down list.
  • The chart will show in the worksheet.
We can create a various type of chart for visualizing excel data. Excel chart allow you to create a chart like a line chart, column chart, Pie chart, Bar chart, Area chart, Scatter chart, Surface chart or many another chart. We 'll discuss all types of chart one by one.


Column Chart 

A column chart is used to compare values across categories and it uses vertical bars to represent the data. To create a column chart follow some steps:
  • Select the range of the input data or set of values.
  • In the insert tab, click on a column from the charts.
  • Select any column chart from the Drop-down list.
  • Get the Result.


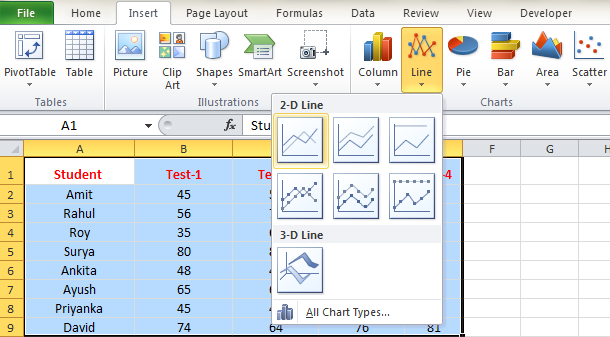
Line Chart

A line Graph in excel is used to display trends over time. The data points are connected with lines to see whether value are an increase or decrease over time. To create a Line Chart follow some steps as
  • Select the range of the input data or set of values.
  • In the insert tab, click Line from the chart group.
  • Select any line chart from the Drop-down list.
  • Get the Result.


Pie Chart

Pie chart is used to display the contribution of each value to a total pie. Pie chart always uses one data series. To create a pie chart follow some steps:
  • Select the range of the input data or set of values.
  • In the insert tab, click Pie from the charts group.
  • Select any line chart from the Drop-down list.
  • Get the Result.


Bar Chart

Bar chart works same as column chart but it uses horizontal bars while column chart uses vertical bars. It is best to compare multiple values. To create a bar chart follow some steps:
  • Select the range of the input data or set of values.
  • In the insert tab, click Pie from the charts group.
  • Select any line chart from the Drop-down list.
  • Get the Result.


Area Chart

An area chart is similar to the line chart, except the areas under the lines are filled in. This chart shows differences between several sets of data over a period of time. For creating an area chart follow some steps:
  • Select the range of the input data or set of values.
  • In the insert tab, click Pie from the charts group.
  • Select any line chart from the Drop-down list.
  • Get the Result.


Scatter Chart

Scatter chart is also known as X-Y chart and similar to Line chart. It is used to find out the relationship between two variable X and Y means to compare the pair of values. To create Scatter Graph follow some steps:
  • Select the range of the input data or set of values.
  • In the insert tab, click Pie from the charts group.
    • Select any line chart from the Drop-down list.
    • Get the Result.


    Switch axis in Chart

    Sometimes after creating the chart, data may not be grouped as you want. In this case, you need to change the axis or switch row and column or switch horizontal axis by vertical axis and vice versa.
    To switch the axis follow some steps:
    • Select the existing chart. The chart tools tab appears.
    • In the design tab, Select Switch Row/Columns.
    • Get the Result.


    Chart Title

    You can add the title in the chart. For add title follow some steps:
    • Select the existing Chart. The Chart Tools tab appears.
    • In the Layout tab, click chart Title then Select Above Chart.
    • Enter a Title as you want.
    • Get the Results.


    Legend Position in Chart

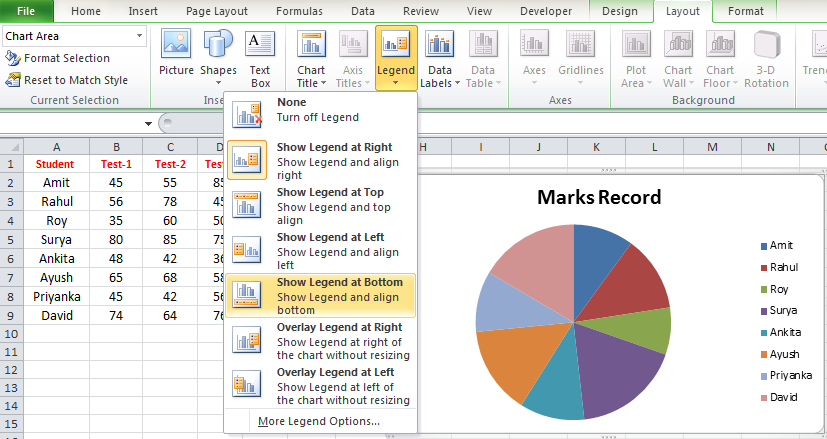
    Legend Position identifies which data series each color in the chart represents. You can change the legend position where you want to display the legend. By default, excel legend appears to the right of the chart. You can move the legend to the bottom of the chart, left of the chart, Top of the chart or any location where you want to see. Let you want to move the legend to the bottom of the chart then follow some steps as: 
    • Select the existing excel chart. The chart tools tab appears.
    • In the Layout tab, Click Legend and select show Legend at Bottom.(you can also select any location)
    • Get the result.


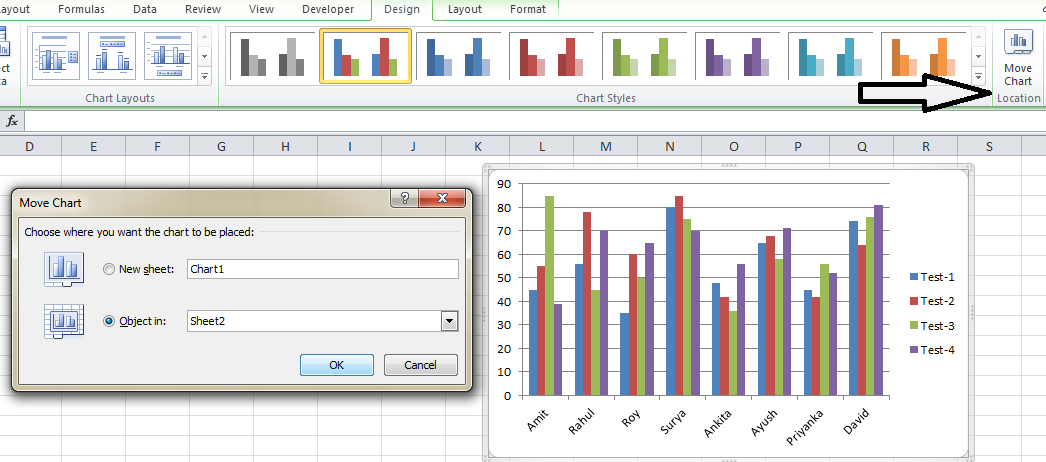
    Move Chart to different Worksheet

    You can move chart from one worksheet to another worksheet. For this process follow some steps as:
    • Select the existing chart. The chart tools tab appears.
    • Select the Design tab.
    • Click on the move chart.
    • A dialog box appears. Select the current location of the chart.
    • Select the desired location of the chart.
    • Click OK. The chart will display the new location.


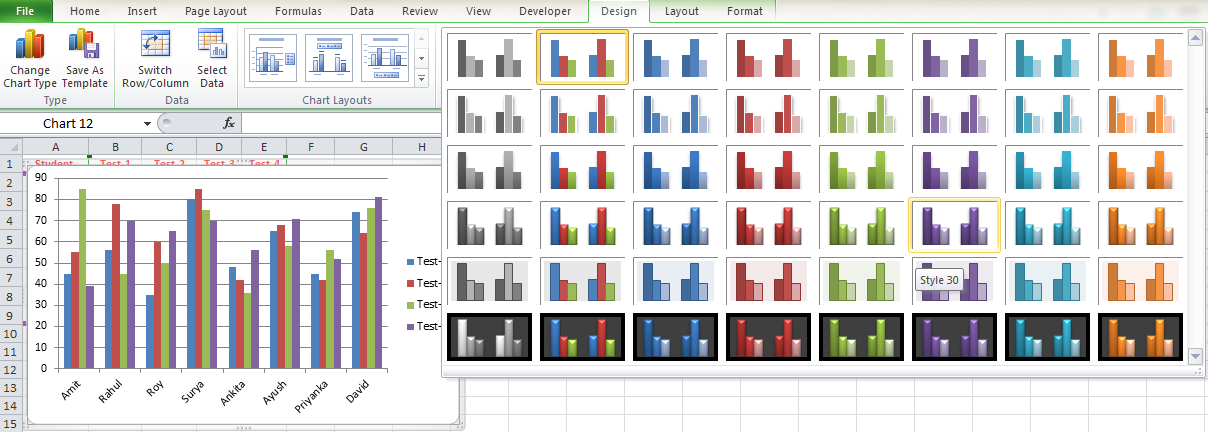
    Change Chart Style

    You can also change chart style, follow some steps:
    • Select the existing Chart. The Chart tool tab appears.
    • Select the Design tab.
    • Click the Move Drop-down arrow in the Chart style group and see all available charts.
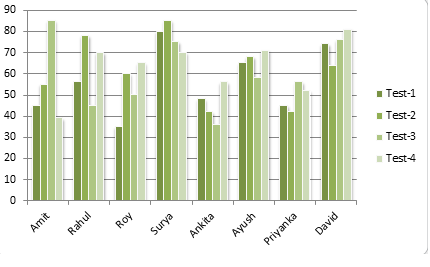
    • Select the Desired style.
    • The chart will update to reflect the new style in the excel worksheet.

    Add Data Labels to a Chart

    Data label makes a chart easier to understand about a data series or its individual data point. It can use to focus reader attention on a single data series or data point. You can add labels to one series, all the series or one data point. To add Data Labels to a chart follow some points as discuss below:
    • Select the existing chart. The Chart Tools tab appears.

    • Click on the data series or chart series or whole chart.
    • In the Layout tab, click Data Labels.
    • Select any labels from the Drop-down list.(Depends on your need)
    • Get the Results.(see the labels on your data series or chart)


    Conclusion:
    Thus, in this post, we discussed how to Create a Graph in Excel. As we know the graph is the best way to visualize data in a clear and understandable way and it is also helpful when we want to compare two value with the same situation. We hope that you like this post. If you like this post then you can share with friend, colleagues, and relatives. We'll update this post on the regular basis. You can also share this post on facebook, twitter, Instagram or other social media website. If you have any doubt regarding this post then you can write your query in the comment section. We'll revert back to you as soon as possible.