Thursday 30 June 2016

Use Of MS Excel In Business

Use Of MS Excel In Business: Hello friends,in this post we'll discuss the use of MS excel in business it means how MS Excel becomes a business more effectively. As we all know that MS Excel provides the business tools for analysis the information quickly and effectively. We use MS Excel in daily life to manage our financial records. Today MS Excel becomes a useful tool for all the business field.

The Importance of MS Excel in Business

MS Excel is the most powerful business tool used in the business today. It is used to managed all the financial transactions that occur between the sellers and the customers. It is required for the workers and the employee to know all the functionality of MS Excel. It required in the work report of the daily work it means all the officers prepare a spreadsheet of their daily work and then report to the senior officers. Thus MS Excel spreadsheet are commonly used in the businesses to display all financial transaction and other important information of the business like sales report, stock report, and details of daily expenditure.


Five Basic Uses of MS Excel in the Work Place

MS Excel provides several features for the businessman and a company. For using this tools, we can manage all the financial and personal data. Here we'll discuss some MS Excel features that are mostly used in the business:

  • Accounting

Small business like personal business MS Excel as a basic accounting or maintain ledger. We can collect and display all the business transaction in the spreadsheet. Normally we used ledger for maintaining a financial transaction manually it means Debit-Credit transaction. Same we can display all Debit-Credit transaction in the worksheet. Thus we can show all the incoming income with the expenditure and also create Chart or Graph for measure business income and expenditure. It saves time and easy to access any transaction. MS Excel provided Accounting features for analysis of the business transaction easily and more effective.

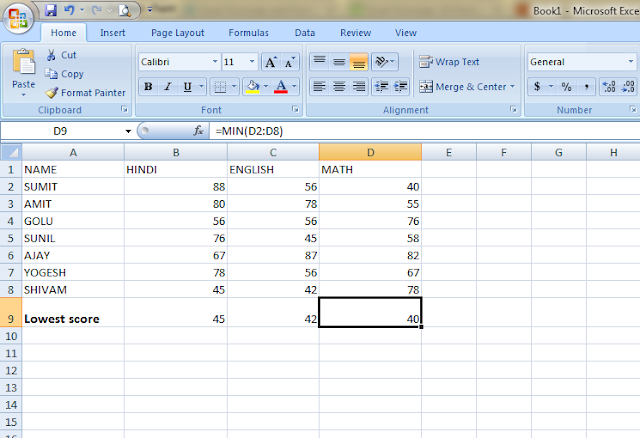
  • Build Chart or Graph

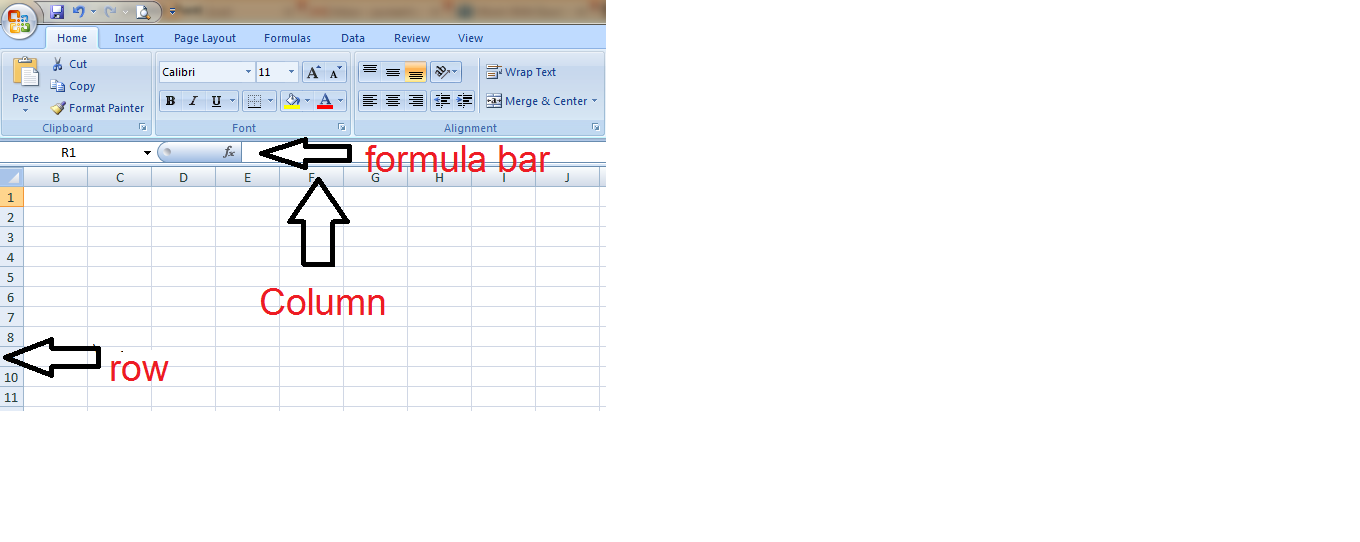
MS Excel provides a visual representation of the business data that display all the business data in the worksheet. We insert all the data into individual cells in row and columns and apply formulas on the cells according to the requirement. Here we can create pie chart or Graphs in the worksheet to make the business report more attractive. By using chart or graph, we can analysis the growth of the business of the individual year, month or a specified period of time. Visualization gives more impression and used for better marketing.

  • Use Conditional Formatting

It is a powerful tool in the MS Excel Spreadsheet. Excel users can format their spreadsheet using some different formatting like colours, bold and italic the text. It provides the attraction to the user by using some attractive formatting. If we want to highlights some necessary information then use bold, italic or change the colour of the information. It is basically used in the business report because it gives more attraction to the users. Using Conditional Formatting, we can compare two or more values and also use a filter to find duplicate values or records.

  • Return On Investment

MS Excel provides tracking of total business sales along with total expenditures it means we can track return on investment. In MS Excel spreadsheet put all the sales transaction with the expenditure transaction then make a Graph for sales and expenditure for tracking the net income. By this feature, we can analysis that our business is going in the profit or loss.
For Example, If we sell 10 units of a product each week at Rs 200 profit each and launch an advertising campaign that costs Rs 2000 each week so we'll need to sell additional product to break even on that campaign otherwise no return on the investment.

  • Bring Data Together

Excel provides to bring information from various files and documents together so that we can put all the information at a single location. It allows importing text and image from the other spreadsheet or from any location. As well as we can merge the data of the different spreadsheet. For that, we go to the Insert Tab and fetch all the necessary information from either current worksheet or any system location. Generally, we can insert an image, Clip Art, Shapes, Smart Art and Screenshot.


Conclusion

Thus, in this post, we have discussed the key points of MS Excel in business. Here we have focused on how MS Excel use in business. If you like this post then you can share it with your friends, colleagues, and relatives. We'll update the information on the regular basis. You can also share this post on facebook, twitter, Google+ or other social media website. You can give any suggestion in the comment section. We'll revert back to you as soon as possible.

Tuesday 28 June 2016

How to Select Cells In MS Excel | Text Selection

How to Select Cells In MS Excel: In this lesson, We'll learn how do I select something on excel. It is a beneficiary if you want to select several cells with similar information. Here we can use Excel Find and Replace features for finding any cells and replace those cells which you want to change any information in the chosen cell. This feature is commonly used when we want to change any particular information out of whole information. We can also find the function by this features.

Steps For Finding The Cells in MS Excel

There are some steps to find any particular cell, follow these steps:
  • On the Home tab, click Find and Select option and then click on Find or press [CTRL]+F.
  • A Find and Replace Dialog box appear, type the text which you want to search.
  • Click on the Find Next button if the text is not matching with your text and click to Find All button to check all the occurrence of the information.

How to Select Cells In MS Excel, How to Select Text In MS Excel


Here we'll discuss this features by an example. We've some gadget information according to their price. Here we've some Item name , its Company name, and its Price and here we  want to find an item laptop with the company name "DELL". The first click on Find and Replace and click on Find. Type the text means Item name i.e. laptop. Here there is two item with same name "LAPTOP" so click on the Find Next and this item is matched with our search item then stop here.


How to Select Cells In MS Excel, How to Select Text In MS Excel


Steps For Replacing the Cells in MS Excel

Now our next step is to replace the cell which we want. For that we follow some steps as mentioned below:
  • First, press Find and Replace option then click on the Replace option.
  • Then type the updated data means replace data.
  • Then click on the Replace option .
How to Select Cells In MS Excel, How to Select Text In MS Excel

As we mentioned above that we want to change the Item name from "Laptop to Tablet" which company name is DELL. For that first of all, we click on Find and select then click on Replace option. Then Find the particular information which we want to change. After search item, go on the replace option and type the information which we want to update and click on the replace option . Here information is successfully` updated . We update only single cell but we can update more than one cell at a time which has similar attributes.


How to find used functions in the cell

We can also find the functions which are used in the particular cell of our Spreadsheet. For that follow some steps as follow:

  • First press Find and Replace then click on Find option.
  • Then type the function name in the Find field.
  • Click on the Find Next option and stop here.


  • How to Select Cells In MS Excel

    If we want to FIND the function of any cell, here we want to find count function in our spreadsheet so first we go to the FIND and replace then click on the find option and type count function like =count(E2:E9) .It is basically used for find any particular function.


    Conclusion

    Thus, in this article, we have discussed How to Select Cells In MS Excel. If you like our article then you can share it with your friends, colleagues, and relatives. You can also share it on social media websites like facebook, twitter , Instagram and all.  We'll update on the regular basis. If you find any issues regarding this article , you can write in the comment section. We'll revert back to you as soon as possible.

    Friday 24 June 2016

    The Future of Distribution: Q&A with Frank Hurtte

    Looking ahead in Distribution

    Perhaps it’s the economy, maybe it’s the weather, could be a coincidence, but a lot of folks are wondering what the future might hold for distributors. Just to give you a flavor, during the past couple of weeks I have heard the term “disintermediation” used as a looming threat from some credible sources.

    The following are a number of questions forwarded to me for commentary by a writer for Electrical Wholesaling. These will be combined with the expert opinion of others in the distribution industry and published sometime in the coming months. I will share a link to the complete article when it is available, but in the meantime, here are some of my comments.

    Question:
    Looking ahead 5 years in the electrical distribution world, some estimate fewer than 200 distributors will exist. What are your thoughts?

    First, I believe the distributor model will change. The “safe” size for a “garden variety” electrical distributor has grown much since my first introduction back in the late 70s and it continues to accelerate. Looking back, in the 70s a sub-$10M electrical distributor was quite viable, by the mid-90s the number had grown to about $20M, today the number is probably $50M but in five years anything less than $100M will feel the pressure.

    Let me make a point, I don’t see small distributors dropping like flies. Instead, I see an increasing number of “baby-boomer vintage” owners running out of steam and realizing the business probably can’t be passed along without severely inhibiting the operating capitol.

    Further, I see a lot of distributors with business models that have morphed into something outside the normal value-add product model. They have added engineering, fee based-services and have also imbedded themselves into their customer’s process in a way which builds their importance to both customers and manufacturers. Their model crosses over the line into what used to be viewed as the duties of manufacturer’s reps and systems integrators.

    Back to the question, I believe consolidation will continue. But, I believe the 200 number is pretty low. Over the next five years, I see the number shrinking but something like 25-30%.


    Question:
    How will the independent distributor survive as it competes against its larger national rivals, many of whom have national contracts? Do you predict a sharp increase in M&A Activity?

    First, there will be a sharp increase in M&A activity. For instance, in the past six or eight months there has been a lot of activity in the Rockwell Automation channel. I see more of this into the future, along with the issues I have already outlined.

    Along the M&A activity line, I see many distributors in Automation side of the electrical business who are approaching retirement age without strong succession plans. Revisiting the old adage, “you can’t take it with you.” In the next few years, a lot of these owners will face the need to do something. The bigger and aggressively mid-sized distributors in the acquisition mode offer up an exit strategy which may be easier than a succession strategy.

    Competing against much larger distributors will require a shift in business model. If a small distributor goes head-to-head with a larger competitor on product availability, price or e-commerce capability they will lose – period. However in the past, larger companies struggle to provide a customized set of services to closely match customer needs. This is particularly true in highly technical areas. I don’t see technology getting easier anytime soon, instead I see technology growing more pervasive.

    Finally, some of the smaller distributors will be propped up by manufacturers because the larger guys do a sloppy job of introducing new products. Regardless of all the hoopla, the story from distributor supply partners has remained constant. The larger guys prefer to service the demand for products rather than assist in creating market demand by finding applications for new products or discovering innovative applications for existing products.

    Question:
    Some “traditional” industrial distributors are trending towards buying companies to complement their current business. Wesco, for example, has been widely known as an electrical distributor, recently bought a safety distributor. They are now an MRO supplier/supply chain strategist. Do you see this as temporary or a growing trend?

    In the future there will be very few “pure electrical” distributors. We have already see this as distributors launched into the data-com world a little more than a decade ago. Today we see electrical distributors in the safety, motion control, automation, fluid power, power transmission and the industrial market. Over the course of time, this will accelerate.

    Why is this happening? First, for solutions-based distributors, customers are demanding it. They want to buy a full solution not just the electrical components. For MRO/Logistically focused distributors, the emphasis is similar; providing a larger market basket of goods to their customer base.

    In the past, distributors have launched out into adjoining lines of trade only to discover that breaking into the field was more difficult than they imagined. For most the move took five years or longer. And, during this time, they struggled to justify inventory. And the product/application expertise required to be credible in the market ate into their bottom line.

    Acquiring a distributor already in the space makes more since because it creates a cash flow during the ramp up years. Further, acquiring brings existing relationships with first tier supply partners which are difficult to build from scratch. Lastly, buying someone also brings along the needed expertise to support the sales efforts and drive credibility in the market.

    Question:
    How important will Big Data be for distributors?

    Distributors will need analytics to produce maximum results into the future. In general, the group gets failing results today. Pricing systems are poorly maintained and rarely use state of the art process (like David Bauders’ Strategic Pricing Associates) to find the proper balance between pricing sensitivity and gross margin. Sales efforts are mostly poorly analyzed as most distributors still rely on time consuming manual manipulation of data.

    Further, operational issues can now be pushed to “big-data” process. For instance, many distributors still manually enter customer purchase order information into their systems wasting countless hours of highly skilled workers who could be assigned to tasks with better return.


    Question:
    Considering Amazon Business has focused on logistics and quick delivery, do you feel distributors may overhaul their delivery systems?

    First, lots of distributors in the electrical space make customized deliveries without thinking about the type of customer. For instance, they provide free delivery to customers who aren’t really profitable. Lots of times, they roll out their delivery truck for boxes that could be sent UPS for three bucks because the sales team thinks delivery on the truck costs nothing.

    Secondly, very few distributors understand what their delivery system costs. Add vehicle cost, fuel cost, driver salaries to all the other variables and you can rack up dollars faster than you expect.

    Finally, the local distributor’s biggest differentiator comes with delivering products which are both heavy and lower cost. Amazon might out do us on the 10 ounce sensor that costs 100 bucks, but they can’t handle the bundle of conduit that weighs 500 pounds and sells for 200 dollars. Distributors need to be smart on this. If they find themselves delivering only the heavy (and bulky stuff) without considerable quantities of the lightweight goodies, they are probably losing money.

    I see progressive distributors placing a value on deliveries and sometimes charging for big stuff. I see distributors getting better at using all the options available including some of the same advanced logistics as Amazon.

    Question:
    How will all these changes affect the supply chain and the distributor/customer/manufacturer relationship?

    We have to understand the Electrical Wholesaling industry is not a way of life, it’s a business model. As soon as manufacturers determine they can go to market more effectively and efficiently through some other model, they will shift their focus. Regardless of their commitment to distribution, loyalty and all the rest, if reaching customers works better some other way, they’ll be all over it. They have to in order to survive.

    We have already seen this process in the lighting industry. With LED technology, the lighting market is changing. The lamp companies don’t necessarily need a distributor to sell something that lasts for twenty years. The replacement lamp business will come to a close in the next ten years if not the next five.

    Manufacturers will be forced to demand POS data in order to better understand the flow of their products to market and who buys the stuff after it lands on the distributor’s dock. It’s a premise of modern manufacturing.

    Manufactures will insist on better analytics from their distributors. In some instances, supply partners will require additional staffing in the form of product specialists, application engineers and professional marketers to drive new product/technology introductions to the market.

    Question:
    How does the buyer fit into all these changes? Will expectations change? The focus used to be product, price and availability. How will buyers change their patterns and what this will mean for “relationship selling?” Will relationships still matter?

    Relationships – people buy from the folks they trust. Trust doesn’t necessarily belong entirely to people. For instance, I trust Hotels.com. While I am a once in a blue moon customer to the hotel, to Hotels.com, I am a constant repeat customer and am rewarded as such. I believe people trust Amazon because they rarely screw up orders and when they do they fix the issue with zero hassle. Distributors must get the service right and eliminate issues that erode trust.

    Pure relationship selling still works for small contractors and other small to mid-sized privately owned companies. In this environment, a relationship with the owner/operator/manager still counts.

    Trusting relationships at Fortune 1000 sized companies is fraught with danger. When the chips are down and the buyer must pick between you and keeping their job, you’re out; in a heartbeat.

    For larger customers, selling will be about providing an ongoing economic advantage to the customer. This basically boils down to a few items, can the distributor:

    • eliminate people from the process? 
    • help improve productivity?
    • assist in eliminating waste?
    • drive down utility or other costs?
    • assist in meeting governmental regulations?

    This is an economic sell and requires selling to different people.

    In the future, upper-quartile distributors will excel at building relationships with upper management people who understand the economics of the sale. Today, very few distributors nurture this level relationship.

    Question:
    An electrical distributor who relies solely on the sales of electrical products may not survive. What should electrical distributors be doing to try and position themselves for growth-and survival?

    Selling electrical products “only” will not kill a distributor, if they are large, they can leverage their suppliers and provide pricing which is near best in class. For small distributors, tying to electrical products “alone” is a recipe for quick financial disaster – most likely during the next major recession. For mid-size distributors, the strategy will equate to longer term stagnation. If the ownership is 50 plus, they will most likely survive till retirement; just don’t encourage the kids to get into the business.

    Question:
    With the blending of automation, electronics, etc. in the electrical industry, what effect do you foresee this having on the marketplace, specifically do you see new competitors or new forms of competitors on the horizon?

    Will there be new competitors? You bet. For those playing in the automation space, expect lots of competitors. The automation space, especially around motion control, lies at the crossroads of fluid power, power transmission and electrical technology. We have already seen lots of conflicts in this market. More to come.

    The Internet of Things (IoT) and its industrial cousin, the Industrial Internet of Things (IIoT) promises to be a boom market in the not so distant future. This attracts not only the normal cast of competitors but some biggies like Cisco and others from the IT field. I am optimistic that a few electrical distributors will be big players, but they will be fighting it out with a whole new set of competitors.

    Further, the line between some distributor and systems integrator (and even contractors) is blurring. New technology players in technical spaces are turning to SI’s because they got terrible reception from the distributors they approached. In this play, the SI ties product sales to services and replaces many tasks once conducted by distributors.

    Finally, there are a host of off-shore companies with plans to break into the US market. They have made the rounds of distributors and have a difficult time getting traction with established wholesalers. They get little respect because they currently don’t have the market share required to produce instant results. But, many of these organizations are big enough and powerful enough to create other alternatives. I believe some will circumvent traditional distribution and thus create new competitors in our market.

    What will the future hold?
    Changes lots of changes. This doesn’t cover all of the changes but it does touch on quite a few major ones. We are interested to hear from you on your prognostications for the future. What will your world look like in 2025?

    Shoot us an email and receive a shiny new post card from Iowa.

    Thursday 23 June 2016

    How to use MS Excel Formula

    MS Excel Formula: Hello Friends! Today We'll discuss how to use MS Excel formula.You know formula is an expression which calculates the value and gives the result in the worksheet. MS Excel formula is used to decrease the time because manual calculation takes more time . Here you will find all necessary formula which is used in the spreadsheet when you are the prepared report in the MS Excel. It also increases your data accuracy.

    Guidelines to Use MS Excel Formulas

    There are so many formulas in MS Excel spreadsheet. Here we'll discuss all the useful formulas as :

    1. SUM

    SUM formula is simply used to add two or more than two numbers together. We can add more than one cells together. If we want to add some cells then simply use the cell names with the commas and id we have the range of cells and want to add the range of cells then use the colon with the associated cells.

    Formula Used: SUM(A1,A2) or SUM(A1:B5)

    To perform this operation, follow some steps:
    1. Select the cell
    2. In the resulting cell, type the equal sign(=)
    3. Type the formula like SUM(A1:B5)

    2.COUNT

    Count Formula is used to calculate the total number of cells in the given range. This formula counts only numbers. If any cell has any alphabet data, this formula is not considered that cell. 

    Formula Used: COUNT(A1:A8)

    NOTE : Here cell A8 has alphabet data so this formula is not covered it.

    3. LEN

    The LEN formula is used to find the character in the cell. This formula also includes space as a single character .

    Formula Used: LEN(A1) or LEN(A2)


    See that if we write MY FIRST SHEET with space then it count space and length is 14 and same as if we write the same word without space then length is 12.


    4. LEFT, MID, RIGHT

    These formulas provide the specified number of characters from text strings. LEFT formula gives you the number of character from the left text strings, RIGHT formula gives you the number of character from the RIGHT text strings and MID formula gives you the number of character from the mid of text strings.

    Formula Used: LEFT(A1,1), MID(A1,3,5), RIGHT(A1,6)


    I used LEFT formula to get the first word from the string like we have a string "I Love India" so we used LEFT formula to get the word "I". Similarly, I used RIGHT formula to get the right most word from the string, and get the word "India" and I also used MID formula to get the mid-word from the text string and get the word "Love".

    5.CONCATENATE

    This formula is basically used for combining data in two or more cells into a one cell. It can be done by using some symbols. 
    Formula used : CONCATENATE(A1,"",B1)


    Here we have two words "AMIT" in cell A1 and  "KUMAR" in cell B1 and we want to combine both words and display into one cell so we can use this formula to concatenate both word and display "AMIT KUMAR" in a single cell. The symbol " is used for spacing between both characters.

    6.MAX 

    This formula is used for finding the largest numbers in the range of the numbers. If we have a more data and we want to find the largest data among them then we can use this function.

    Formula Used: =MAX(B2:B8) or =MAX(C2:C8) or =MAX(D2:D8)


    Here we have a data of the text score and we find the largest score in each subject so for find the largest score in each subject, MAX function is used.


    7. MIN

    It works exact opposite to MAX function. It is used to find the lowest numbers from the range of the numbers. We can find the lowest numbers using this formula.

    Formula Used: =MIN(B2:B8) or =MIN(C2:C8) or MIN (D2:D8)


    Here we have also a data of text score and we find the lowest score in each subject so we can use MIN function to find the lowest numbers among the range of numbers.

    MS Excel Formula

    Thus, in this post, we have provided how to use MS Excel formula. If you liked our post then you can share it with your friends, colleagues, and relatives. You can also share it on social media website. If you find any issues regarding this post you can write down to us in the comment section. We will revert to you as soon as possible.

    Wednesday 22 June 2016

    How To Use MS Excel - Beginner's Guide

    How To Use MS Excel: Hello, Friends! In this article, You'll learn about MS Excel spreadsheets such as rows, columns, and cells. Excel is a program that provides a worksheet that includes rows and columns. Here we'll discuss how to use MS Excel rows and columns in the spreadsheet and how to move from one spreadsheet to another. We'll also discuss how to enter the data in the row & column.

    We'll tell you all the things that you need to start the work on MS Excel.If you are the beginner and want to use excel spreadsheet for your personal use then follow the following steps as mentions below.  

    How To Use MS Excel - Step by Step Guide

    An Excel is a two-dimensional view with rows and columns. The columns are represented by alphabet and start with A and rows are represented by numbers and start with number one. The formula bar is used to perform any operation. What you type in the spreadsheet, it is also displayed in the formula bar.

    There are many ways to selects cells in the spreadsheet as follow:
    • If you want to select a one cell then click in the cell.
    • If you want to select more than one rows of a cell then click on the row numbers.
    • If you want to select more than one column of a cell then click on the columns letter.
    • If you want to select all the cells in the worksheet then click in upper right corner of the worksheet to the left of "A".

    How to enter Data into Cells

    First, click in the cell where you want to enter data in the cell and begin typing. The data which you type in the cell also  show in the formula bar of the spreadsheet. If you want to do some changes in the data then you can change data from the formula bar or from directly inside the cells. To edit the data in the cell ,either double click inside the cells or select the cell and press the F2 key .

    How to Move Cells and Copy Cells

    If we want to move the cell content or copy cell content from one cell to another cell then right-click in the selected cell and choose the cut option. Then select the new cell location and again right click and choose the paste option.

    How to Insert and Delete Rows and columns

    If you want to insert a new row in the spreadsheet then right click on a row number and choose the insert option. MS Excel always inserts a row ABOVE the row that was select on. If you want to insert more than one rows then press the F4 key to insert each additional row. To delete a row, right click on the row number and press the delete then one row is deleted from the spreadsheet.

    Same as, If you want to insert a new column in the spreadsheet then right click on a column letter and select the insert option. MS excel always inserts a column to the LEFT of the column that was select on. To insert more than one columns , press F4 key to insert each additional column. If you want to delete any particular column then right click on the column letter and press delete.

    How to View, Rename, Insert and Delete Worksheet

    We can rename, insert and delete any excel worksheet from the worksheet tab. Worksheet tabs are placed in the bottom left of the workbook. 
    • To view a worksheet, click on the worksheet tab.
    • If you want to rename any worksheet ,just right click on the worksheet tab and select a rename option from the menu and type the new name of the worksheet.
    • To insert a new worksheet ,right-click on the worksheet tab and select an insert option from the menu. MS Excel always inserts a new spreadsheet to the left of the current spreadsheet.
    • To delete an existing worksheet , right-click on the particular spreadsheet tab and select a delete option from the menu, now one spreadsheet is deleted from the workbook.


    We hope that the overall information is helpful for the MS Excel beginners. If you like this article and helpful for you then you can share it with your friends,colleagues and also share on the social media website. You can also write your query  in the comment section. We'll revert back to you as soon as possible.

    Monday 20 June 2016

    We need more sales calls, but it’s not happening!

    Business levels are flat (at best) and sales managers are clamoring for more sales calls.  All across distributor-land, sales managers are pushing their teams for more productivity.  They reason more sales calls equates to more discovery, more opportunities to quote and greater visibility with customers who for some reason or another share their business with several suppliers.

    The pressure is on.  Ranging from kind requests to outright threats, sales managers are pushing for more calls.  In cases where the distributor uses some form of call reporting (CRM or otherwise), the reports are getting greater scrutiny and results aren’t pretty. 

    Under pressure to create a better looking report, salespeople are counting drop by visits with no actual customer contact as a “sales call.”  Under the heading of a good example of terrible selling behavior, one reported sales call consisted of driving up to the guard shack of the customer and asking for the head of maintenance.  Since the seller had no appointment and lacked the name of the individual, they were summarily turned away.  Another slightly more credible example of a sales call involved the sales person making a delivery to the customer’s facility where the only contact came with the receiving clerk.  Clearly, this type of behavior does little to impact the bottom line.

    Why aren’t we seeing more people?
    I believe there are a number of reasons that our salespeople are not seeing more people.  But before I rattle off the reasons, allow me to say I don’t believe sloth has anything to do with the situation.  Lack of skill, sometimes.  Bad habits, probably.  Deliberate laziness, no way. 


    Finally, here is my list for why salespeople can’t improve their number of calls:
    • They fail to plan their time.  As sad as it seems, on any given Friday afternoon many can’t tell you what they are doing next Wednesday afternoon, unless that day happens to be vacation or the next sales meeting.  Planning is both a skill and a habit, both of which can be improved.
    • They fail to optimize travel times.  Only a few of the sellers we know have territories compact enough to ignore travel times.  The guys in secondary markets drive 50 miles to make a sales call without considering stops along the way.  Folks in big cities cover less distance, but the effect is the same.  Only a rare few plot their day in a way that offers maximum time with customers.
    • They fail to make appointments.  Could be a habit, could be a skill or it could be their customers just plain don’t want to see them.  Getting appointments are hard (not impossible) to make these days.  A lot of folks have just plain given up on making them.
    • They get sucked into mundane tasks.  Some return to the office to follow-up on trivial orders, others drop what they are doing to immediately respond to a quotation and others get hung up on “baby sitting” customer orders.  A few simply don’t trust their support team enough to carry out even small tasks.  A good many are control freaks who feel good about controlling more than they should.  While all of these might be important, they need to maximize team involvement.
    • They spend too much time to responding to customer emergencies. 
      Technically oriented sellers often fall into a purely
      reactive mode of operation.  They get personal satisfaction from solving customer emergencies and customers love them for the work they do.  Sounds great, except that when times are slow, they spend more time instead of less time with each emergency.  Further, some salespeople don’t measure their value.  They spend inordinate amounts of time with low volume, small potential customers.
    • The situation is complex and requires individual coaching…Reviewing the list, it’s pretty clear there is no one magic bullet fix.  Out of a half dozen sellers there may be four or five different situations.  This is where the sales manager earns their keep as a manager and coach.


    Over the years we have devised a plan for assisting sales managers understand and respond to individual weaknesses effectively.   As with any type of long-term improvement, it takes time and a bit of effort.  

    Here is the simplified version of the plan:
    • For the next 6-8 weeks set aside a time on either Friday afternoon or Monday morning to review each seller’s activities planned for the next week.  Experience shows this takes about 20 minutes per salesperson.  Let them know this is not a permanent procedure but a 6-8 week coaching assignment for the manager.
    • Specifically log the data as to where they plan to go, who they want to meet, what they plan to discuss, whether an appointment will be set and the proposed date of the call.
    • During the same meeting, review the results/details of the last week of calls.  When possible match the planned week to the actual results (a week later).
    • Look for the following:
      • Issues with scheduling.  Are they really planning ahead?
      • Issues with setting appointments.  Do they need some coaching here?
      • Emergencies which took them out of the field.  Are they justified or just control issues?
      • The products, services, issues discussed.  Customers don’t want their time wasted.  Are the products properly selected?  Are they bringing the right sales materials?
    • Identify individual issues which need skills training, coaching or management.


    Coaching works better when individualized…
    They say it takes 30 days to break a habit and longer to develop a new skill.  Don’t expect instant perfection.  In fact, you should expect improvement sandwiched between in a bunch of returns to the old habit.  But, don’t let your team wear you down.  Improvement will come.  It takes a while but our work indicates a couple of months spent today can change things for a long time.

    Finally, we would love to chat about your unique situation…

    Drop us a line or give a call.  We would love to hear about your situation.  We have plenty of resources available and a good many of them are… free.

    Sunday 19 June 2016

    Data Science Course Content

    Please find the attached data science course content.  

    Course Name: Data Science 

    Duration: 75 to 95 hours, an hour everyday, 3 Months.

    Fee: $1200. Instalments will be accepted. 

    Domain KT: Banking, Retail, Telecom and Insurance
    ​​
    Training Mode: Online through gotomeeting

    Projects: Sample projects will be assigned along with R , Python and Spark code support

    Payment Mode: Credit/Debit Cards/Online Transfers will be accepted. 

    Job support, Interview and Resume building support will be provided.


    Data Science by B N Reddy
    About this Course
    In this course you will understand all basics to advanced statistics and learn how to program in R & Python and how to use R & Python for effective data analysis. You will learn how to install and configure software necessary for a statistical programming environment and describe generic programming language concepts as they are implemented in a high-level statistical language. The course covers practical issues in statistical computing, which includes programming in R & Python, reading data into R & Python, accessing R packages & Python data science library and frameworks, writing R & Python functions, debugging, profiling R & Python code. Topics in statistical data analysis will provide working examples.
    What are the pre-requisites?
    There are no pre-requisites. No prior knowledge of Statistics, the language of R, Python or analytic techniques is required.
    This course covers from basic to advanced Statistics and Machine Learning Techniques
    Duration
    75 to 95 Hours, An Hour Session Every Day

    1.             Introduction to Data Science

    ·      Introduction to Data Science, Tables, Database, ETL, EDW and Data Mining
    ·      What is Data Science?
    ·      Popular Tools
    ·      Role of Data Scientist
    ·      Analytics Methodology


    Data Science Techniques of Math and Statistics


    2.             Descriptive and Inferential Statistics

    Statistics is concerned with the scientific method by which information is collected, organized, analyzed and interpreted for the purpose of description and decision-making.
    There are two subdivisions of statistical method.
    (a) Descriptive Statistics - It deals with the presentation of numerical facts, or data, in 
either tables or graphs form, and with the methodology of analyzing the data. 

    (b) Inferential Statistics - It involves techniques for making inferences about the whole population on the basis of observations obtained from samples. 


    Ø Samples and Populations
    §  Sample Statistics
    §  Estimations of Population Parameters
    §  Random and Non-random Sampling
    §  Sampling Distributions
    §  The Central limit Theorem
    §  Degree of Freedom
    Ø Percentiles and Quartiles
    Ø Measures of Central Tendency
    §  Mean
    §  Median
    §  Mode
    Ø Measures of Variability/Dispersions
    §  Range
    §  IQR
    §  Variance
    §  Standard Deviation
    Ø Skewness and Kurtosis
    Ø Probability Distributions
    §  Events, Sample Space and Probabilities
    §  Conditional Probabilities
    §  Independence of Events
    §  Bayes’ Theorem
    Ø Random Variable
    Ø The Normal Distributions
    Ø Confidence Intervals
    Ø Hypothesis Testing
    §  Null Hypothesis
    §  The Significance Level
    §  p-value
    §  Type I and Type II Errors
    Ø Inferential Test Metrics
    §  t test
    §  f test
    §  Z test
    §  Chi square test
    §  Student test

    Ø The Comparison of Two Populations
    Ø Analysis of Variance
    §  ANOVA Computations
    §  Two-way ANOVA

    3.             Data Exploration and Dimension Reduction
    Ø Data Summaries
    Ø Covariance, Correlation, and Distances
    Ø Missing Values Handling
    Ø Outliers Handling
    Ø Principal Component Analysis
    Ø Exploratory Factor Analysis

    4.             Machine Learning: Introduction and Concepts
    Ø Differentiating algorithmic and model based frameworks
    Ø Regression
    §  Ordinary Least Squares
    §  Ridge Regression
    §  Lasso Regression
    §  K Nearest Neighbours Regression & Classification

    5.             Supervised Learning with Regression and Classification
    Ø Bias-Variance Dichotomy
    Ø Model Validation Approaches
    §  Training Set
    §  Validation Set
    §  Test Set
    §  Cross-Validation
    Ø Logistic Regression
    Ø Linear Discriminant Analysis
    Ø Quadratic Discriminant Analysis
    Ø Regression and Classification Trees
    §  Recursive Portioning
    §  Impurity Measures (Entropy and Gini Index)
    §  Pruning the Tree
    Ø Support Vector Machines
    Ø Ensemble Methods
    §  Bagging (Parallel Ensemble) – Random Forest
    §  Boosting (Sequential Ensemble) – Gradient Boosting
    Ø Neural Networks
    §  Structure of Neural Network
    §  Hidden Layers and Neurons
    §  Weights and Transfer Function
    Ø Deep learning
    §  Integrated best features of both Machine Learning and NN
    Ø Forecasting (Time-Series Modelling )
    §  Trend and Seasonal Analysis
    §  Different Smoothing Techniques
    §  ARIMA Modelling
    §  ETS Modelling

    6.             Unsupervised Learning
    Ø Clustering
    §  Hierarchical (Agglomerative) Clustering
    §  Non-Hierarchical Clustering: The k-Means Algorithm
    Ø Associative Rule Mining
    §  Aprori Algorithms
    §  Frequent Item-sets
    §  Support
    §  Confidence
    §  Lift Ratio
    §  Discovering Association Rules

    7.             Text Mining
    Ø Sentiment Analysis
    Ø User Behaviour Analysis
    Ø Topic Categorization
    Ø Topic Ranking

    8.             Recommender Engines:
    Ø Collaborative Filtering Recommenders
    Ø Content Based Recommenders

    Data Science Techniques Implementation by R - Language


    9.             Introduction to R Foundation
    §  Software Installation on Various Operating Systems
    §  Introduction to Real Time Applications
    §  Introduction to Popular Packages

    10.         R-Analytical Tool (Data Mining / Machine Learning)
    Ø Basic Data Types
    Ø R Data Structures
    §  Vectors
    §  Matrix
    §  Data Frames
    §  List
    Ø R Functions
    Ø Predictive Modelling Project based on R
    Ø Classification Modelling Project based on R
    Ø Clustering Project based on R
    Ø Association Mining Project based on R
    Ø R Visualization Packages
    Ø Machine Learning Packages in R

    Data Science Techniques Implementation by Python


    11.         Python - Getting Started

    Ø Installing Python on Windows
    Ø Installing Python on Mac and Linux
    Ø Introduction to Editors
    Ø Installing PyCharm and Sublime Editors

    12.         Python Basics

    Ø Numbers and Math in Python
    Ø Variable and Inputs
    Ø Built in Modules and Functions
    Ø Save and Run Python Files
    Ø Strings
    Ø Python List
    Ø Python slices and slicing

    13.         Python Scientific Libraries for Machine Learning
    Ø Scikit-Learn
    Ø Numpy
    Ø Scipy
    Ø Pandas
    Ø Matplotlib


    14.         Introduction to Data Visualization

    Ø Introduction to Data Science and Visualization Tools in Python
    Ø Installing and Setting up iPython Notebook
    Ø Installing Anaconda and Panda
    Ø Setting Up Environment

    15.          Learning Numpy

    Ø Creating Arrays
    Ø Using Arrays and Scalars
    Ø Indexing Arrays
    Ø Array Transposition
    Ø Universal Array Function
    Ø Array Processing
    Ø Array Input and Ouput

    16.         Working with Panda

    Ø Series
    Ø Data Frames
    Ø Index Objects
    Ø Reindex
    Ø Drop Entry
    Ø Selecting Entries
    Ø Data Alignment
    Ø Rank and Sort
    Ø Summary Statistics
    Ø Missing Data
    Ø Index Hierarchy


    17.         Working with Data Part1

    Ø Reading and Writing Text Files
    Ø Json with Python
    Ø HTML with Python
    Ø Microsoft Excel Files with Python

    18.         Working with Data Part2

    Ø Merge, Merge on Index and Concatenate
    Ø Combining Data Frames
    Ø Reshaping and Pivoting
    Ø Duplicating Data Frames
    Ø Mapping, Replacing, Rename Index and Binning
    Ø Outliers and Permutations

    19.         Working with Data Part3

    Ø Group by on Data Frames
    Ø Group by on Dist Series
    Ø Aggregation
    Ø Splitting, Applying and Combining
    Ø Cross Tabulation


    20.         Working with Visualization

    Ø Installing Seaborn
    Ø Histograms
    Ø Kernel Density and Estimate Plots
    Ø Combining Plot Styles
    Ø Box and Violin Plots
    Ø Regression Plots
    Ø Heat Maps and Clustered Matrices
    Ø Example Projects -15


    21.         Machine Learning Language

    Ø Introduction
    Ø Linear Regression
    Ø Logistic Regression
    Ø Multi Class Classification – Logistic Regression
    Ø Multi Class Classification – Nearest Neighbor
    Ø Vector Machines
    Ø Naïve Bayes Theory

    22.         Prescriptive analytics ( Optimization Techniques)
    Ø Analytics through designed experiments
    Ø Analytics through  Active learning
    Ø Analytics through Reinforcement learning

    23.         Data Science based Projects
    Ø Cover couple of Real-Time Analytics Projects based on R Script and Python Scientific Libraries.

    24.         SPARK MLlib (Scalable Machine Learning)
    Ø RDD Concept
    Ø Spark MLlib: Data Types, Algorithms, and Utilities