Showing posts with label Supply-Chain-Analytics. Show all posts

Thursday, 8 May 2014

Visualizing Forecast Accuracy. When not to use the "start at zero" rule ?

I recently joined a discussion on Kaiser Fung's blog Junk Charts , When to use the start-at-zero rule concerning when charts should force a 0 into the Y-axis.  BTW - If you have not done so, add his blog to your RSS feed, it's superb and I have become a frequent visitor.

On this particular post, I would completely agree with his thoughts was it not for this one metric I have problems visualizing, Forecast Accuracy.


Forecast Accuracy is a very, very widely used sales-forecasting metric that is based on a statistical one, so let's start there.  

The statistical metric (Mean Absolute Percentage Error) looks at the average absolute forecast error as a percentage of actual sales.    Some of the errors will be positive and some negative but by taking the absolute value we lose the sign and just look at the magnitude of error.  (We handle optimism or pessimism in the forecast with a different "bias" metric).  

There is occasionally heated discussion in the sales forecasting community about exactly how this should be calculated but let's save that for another day as all forms I am familiar with have the same properties with regard to plotting results.
  • perfect forecasts would have no error and return 0% MAPE, this is our base.
  • there is no effective upper bound on the metric
If we were to look at this across a range of product groups (A thru K) it might look something like this.  The Y-axis is forced to start at 0 and the length of the bars have meaning, Product D really does have almost twice the error rate of product A.  This plots out very nicely, it's hard to misunderstand  and the start-at-zero rule certainly does apply.


Now convert MAPE into a Forecast Accuracy with this simple calculation.
Forecast Accuracy = 1 - MAPE
I can only assume this metric was created in the sense of "bigger numbers are better".  It's in widespread use, it's part of the business forecasting language, and no, I can't change it.  As you can see below, perfect forecasts are now at 100% and there is no lower bound on the metric, it can easily be negative.
MAPE Forecast Accuracy
0% 100%
20% 80%
40% 60%
60% 40%
80% 20%
100% 0%
120% -20%
140% -40%
160% -60%
This causes me a problem.  Check out the chart below: this is the same data as before but now expressed as Forecast Accuracy rather than MAPE in a standard Excel chart.  Excel is trying to help (bless it) and put the 0 value in without my help.  Work in supply-chain and you will see a lot of these.

The zero value has no special meaning on this metric, so starting at 0 is very misleading:  80% accuracy (20% MAPE) is not twice as good as 40% accuracy  (60% MAPE).

Allowing the minimum of the y-axis to float  does not solve this either (below)


I really don't know what this is trying to tell me... some product groups are better than others perhaps ?  Certainly, relative size is meaningless.

"Abandon it" you say  "go to a line chart".  Line charts often have floating axes and yes they do not emphasize relative size nearly as much as a bar-chart does (below).


Perhaps it's less confusing/misleading than the previous charts but I still don't like it. because there is data I want to compare relative sizes for (the MAPE) and line-charts seem most useful when trying to show patterns.  I have no reason to expect a useful pattern to form from product categories: I just sorted then alphabetically.

My thanks to the contributors on Junk Charts for helping me clarify my thinking on this.  I don't know that there is a great answer but as it's one I run into all the time I do want to find a better solution.  (FYI - It's just hit me that there are another set of supply-chain metrics for order fill-rates than have the exact same problem)

The best I have been able to do with it so far is shown below, by forcing the upper limit on the Y-axis to 100% and letting the lower limit float, I am trying to emphasize the negative space between the top of the bar and 100%, essentially the error rate.


I'm not entirely happy though, those heavy bars do draw the eye, how about a dot-plot instead ?


You would still have to learn how to read it properly ...

Or how about this?  Inspiration or desperation?  I'm now plotting the bars down from the 100% mark, emphasizing MAPE while still using the Forecast Accuracy scale.  I'm not entirely sure yet, but I think I like it and if I generalize the "start at 0" idea to "start at base" it may even fit the rule.


What do you think?  Which version best handles the compromise between a user's desire to see the metric they know and my desire to show them relative error rates?  Have you a better idea?  I would love to hear it - this one really bugs me !  Can you think of any other examples of metrics where 0 is meaningless?


Monday, 5 May 2014

Recommended Reading: The Definitive Guide To Inventory Management

A little over 15 years go now, I was set the task to model how much inventory was needed for all of our, 3000 or so, products at every distribution center.  Prior to this point, inventory targets had been set at aggregate level based off experience and my management felt it was likely we had too much inventory in total and what we did have was probably not where it was most needed. (BTW - they were absolutely right and we were ultimately able to make substantial cuts in inventory while raising service levels).

I came to the project with a math degree, some programming expertise, practical experience simulating production lines, optimizing distribution networks, analyzing investments and with no real idea of how to get the job done.  The books I managed to get my hands on gave you some idea how to use such a system but no real idea how to build it.  They left out all the hard/useful bits I think.  So, I set about to work it out for myself with a lot of simulation models to validate that the outputs made sense.
Product Details
I still work occasionally in inventory modeling and I'll be teaching some components this fall, so I have been eagerly awaiting this new book : The Definitive Guide to Inventory Management: Principles and Strategies for the Efficient Flow of Inventory across... by CSCMP, Waller, Matthew A. and Esper, Terry L. (Mar 19, 2014)

Full disclosure here: one of the authors, Dr Matt Waller is a friend and colleague of mine.  He brings an astonishing level of expertise to many areas of supply-chain management and inventory modeling is clearly no exception.  Together Matt and Terry Esper have produced a book that (had I possessed it 15 years before it was published) could have short-cut my inventory modeling project by approximately 6 months.

This is not a long book, not quite 200 pages in fact, but it is no lightweight.  If you just want an overview of the topic you could skip the math, but my guess is that if you do that, you will never really understand.  The math is not particularly hard and it's presented in a sort of hybrid math/Excel fashion that I find easy to follow.  I'll also say that I hit my first "ahah!" moment before I got to page 20.  I won't embarrass myself by telling you what it was but something that had bothered me for years suddenly clicked into place.

Unlike most discussion on this topic, this book looks at inventory modeling from the manufacturer's or supplier's point of view right through to the retail shelf.  They also provide a number of means to estimate components of inventory from historical data so you can assess how well your planning and execution system are tracking to plan: something I was aware of but had never really thought through how useful it could be.  Details on how to conduct your own simulation studies in Excel and an overview to the most commonly used forecasting approaches that feed the inventory models round it out.

It's all here, what you need to understand (and if you so wish, build) a system to optimize your inventory  holding.  I highly recommended it.


Monday, 28 April 2014

Next-Generation DSRs (multi-retailer)

This post continues my look at the Next Generation DSR.  Demand Signal Repositories collect, clean,  report-on and analyze Point of Sale data to help CPGs drive increased revenues and reduce costs.

Most CPG implementations of a DSR support just one retailer's POS data.  OK before someone get's back to me with "but we have multiple retailers' POS data in our system", I'll clarify:
  • Having Walmart and Sam's Club data in the same DSR does not count (as the data comes from the same single source, RetailLink) and I bet you are still limited as to what you can report on across them.
  • If you have multiple-retailer's POS data set up in isolated databases using the same front-end... it does not count
  • If you have the data in the same database but without common data standards ... it does not count.
  • If you have the data in the same database but with no way to run analysis or reports across multiple retailers at once... it does not count.
So, yes, a number of CPGs have DSRs that support multi-retailer POS data sources, very, very few (if any?) have integrated that data into a single database with common data standards so they can report and analyze across multiple POS sources at the same time.

Does it matter?  I think so, multi-retailer ability opens up big opportunities around promotional-effectiveness,  assortment planning, supply-chain forecasting (demand sensing) and ease of use.


So, why are we not doing this already?

From a historical perspective, you can track most DSR's back to starting out with a particular retailer's data and supporting CPG sales-teams for that retailer.  The sales-team were the folks with the checkbook and they were not very interested in what the system could do with any other retailer's data.  DSR solutions are still often sold to individual sales-teams which is why CPGs support numerous DSR implementations.

Can these solutions support multiple-retailers - yes - sort of - maybe - probably not.  The key issues to resolve are data-volume, data-standardization, localization and security.

Data Volume

From my previous post (Next-Generation DSRs - data handling) I was stressing how circa 2010 technology was struggling to handle the volume and velocity of data involved in a DSR.  And that was with single retailer solutions.  Newer database applications gives us the capability to maintain or improve performance while handling substantially more data  through columnar, massively parallel and in-memory technology.  I fully acknowledge I may be missing a few ideas on that list, it doesn't matter - the point being that a 10 fold increase in data volume is no longer something to be worried about,  Trade up  to new technology and you can handle it.  

Data Standardization

This is dull, really dull, it's right up there with Data Cleansing (boring, painful, tedious and very, very important).  There is no standard for what data a retailer chooses to share with their CPG suppliers.   There is overlap, yes of course, but no actual standards.  They will:
  • call the same facts (e.g. point of sale units) by different names.
  • report facts in different time buckets (weekly, daily)
  • report facts that are 100% unique to a particular retailer (some of which may be useful)
  • have similar but (subtly different) meanings for what appears to be the same fact
  • not provide key facts that seem essential (like on-hand inventory at stores)
And through all this you are trying to find enough common ground to generate reports and analytics that work across retailers.  I can hear the cries now of "but Retailer-X is completely unique, that won't work for us".  Ignoring for the moment the impossibility of degrees of "unique-ness", they are wrong, this really can be done.  All retailers sell, order, hold inventory and promote (to list but a few things).  What is common between data sources is huge, but it takes real discipline to find the commonality wherever it exists and map it to a single data-structure for reporting/analytic purposes.  And when you do find something unique, that's ok:  map it to a new fact, store it and wait.  Perhaps it's only unique because you haven't seen it in another retailer's data feed... yet.

Bottom line - It's dull (I did warn you about that right?) but it can be done.

Localization

When I'm generating a report for retailer X, they call the Point of Sale revenue fact 'POS Sales', retailer Y calls it 'Point of Sale $', retailer Z calls it 'POS Revenue'.  Internally, and when reporting across multiple retailers,  we call it just 'POS'.  How can we support this?

I've coded custom solutions for this before, it's not that hard, but it strikes me that this is just another example of "language" and if we can have the same application work in English, German, Italian, Spanish and Russian, how hard should it be to translate between variations on the same language.

Security

Is Retailer X allowed to see data from Retailer-Y - no way !  Are the Retailer-X sales-team allowed to see Retailer-Y point of sale data - very probably not.  Are my sales folks allowed to see any competitor sales data provided to category managers  - nope.  Do I want the sales-team to see the profit margin on the products they sell?  (This sounds sensible, but actually some CPGs do not want this.  I guess, if they don't know, they can't tell the customer).

These are all issues with DSR's as they stand today and are all resolved already with solid user account management.  If this process is done well, security is not a problem.  If the processes around security management are sloppy, it's already a problem.  Adding more data into the system really doesn't make a difference one way or another.

Bottom line

If a DSR was designed from scratch to support multiple retailers, it would have one single data model and all new data sources get mapped to this single model.

Localization means that the same report for Retailer-X and Retailer-Y is shown with their own naming preferences.

Security controls who is allowed to see what.

And what's in it for you ?

  • You now have the ability to rapidly leverage learnings (in the form of new analytics and reports) across all retailers and sales teams.
  • As team members move from one sales-team to another they do not need to learn a new system or even necessarily, a new "langauge".
  • You get to maintain, develop, learn and train against  just one system
  • And the really big pay-off is that you can now start to run value-added analytics that require access to multiple retailer's POS data .   Think about significantly enhanced promotional-effectiveness,  assortment planning and supply-chain forecasting (demand sensing)  More on this very soon.

Monday, 21 April 2014

The right tools for (structured) BIG DATA handling - columnar, mpp and cloud - AWS Redshift

Today, I'm coming back a little closer to the series of promised posts on the Next Generation DSR to look at some benchmark results for the Amazon Redshift database.   Some time ago I wrote a couple of quite popular posts on using columnar databases and faster (solid state) storage to dramatically (4100%) improve the speed of aggregation queries against large data sets.  As data volumes even for ad-hoc analyses continue to grow though, I'm looking at other options.
Here's the scenario I've been working with: you are a business analyst charged with providing reporting and basic analytics on more data than you know how to handle - and you need to do it without the combined resources of your IT department being placed at your disposal.

Previously, (here I looked at the value of upgrading hard-drives (to make sure the CPU is actually busy) and the benefit of using columnar storage which let's the database pull back data in larger chunks and with fewer trips to the hard-drive. The results were ..staggering. A combined 4100% increase in processing speed so that I could read and aggregate 10 facts from a base table with over 40 million records on laptop in just 37 seconds.  (I'm using simulated Point of Sale data at item-store-week level just because it's an environment I'm used to and it's normal to have hundreds of millions or even billions of records to work with)

I then increased the data volume by a factor of 10 (here), repeated the tests and got very similar results without further changing the hardware.   The column-storage databases were much faster, scaling well to both extra records (the SQL 2012 column-store aggregating 10x the data volume in less than 6x the elapsed time) and to more facts (see below).


400 million records (the test set I used) is not enormous but it's certainly big enough to cause 99.2% of business analysts to come to a screeching halt and to beg for help.    It's also enough to tax the limits of local storage on my test equipment when I have the same data replicated across multiple databases.

I've been considering Amazon Redshift for some time - it's cloud-based, columnar, simple to set up, uses standard SQL and it enables parallel execution and storage across multiple computers (nodes) in the cloud.

First let's look at a simple test - the same data as before but now on Redshift.  I tested 2 configurations using their smallest available "dw1.xlarge" nodes currently costing $0.85 per hour per node.  These nodes each have 2 processor cores, 2TB of (non SSD) storage and 15GB of RAM.    I'm going to drop the "SQL 2012 Base" setup that I used previously from the ongoing comparison - it's just not in the race.


SQL Server 2012 (with the ColumnStore Index) was the clear winner in the previous test and for a single fact query it still does very well indeed.  The 2-node Redshift setup takes almost twice as long for a single fact, but, remember that these AWS nodes are not using fast SSD storage (and together cost just $1.70 per hour) so 41 seconds is a respectable result.  Note, also, that it scales to summarizing 10 facts very well indeed, taking about 50% of the time that SQL Server did on my local machine.

How performance scales to more records and more facts is key and, ideally, I want something that scales linearly (or better): 10x the data volume should result in no more than 10x the time.  Redshift here is doing substantially better than that - is that suggesting a better than linear scaling ? Let's take a closer look.  

For this test I extended the base table to include 40 fact fields against the same 3 key fields (Item, Store and week).  I then ran test aggregation queries against the full database for 1, 5, 10, 20 and 30 facts


The blue dots show elapsed time (on the vertical axis) against the number of facts summarized in each query for the 2 node setup.

The red dots show the same data but for the 4 node setup.

For both series, I have included a linear model fit and they are very definitely linear.  (R-squared values of 0.99 normally tell you that you did something wrong, it's just too good, but this data is real.)  However, there appears to be a substantial "setup" time for query processing:- 31.943 seconds in the case of the 2 node system and 10.391 seconds for the 4 node system.  These constants are the same whether you pull 1 fact, 5 facts or 30 on this basic aggregation query.  Now, as all these queries join to the same  item, and period master tables and aggregate on the same category and year attributes from those tables that should not be a big surprise.  Change that scope and this setup time will change too.  (more on that later)

Note also that as the number of nodes was doubled,  processing speed (roughly) doubled too.

Redshift is a definite contender for large scale ad-hoc work  It's easy to setup, scales well to additional data and when you need extra speed you can add extra nodes directly from the AWS web console.  (It took about 30 minutes to resize my 2 node cluster to 4 nodes.)  

When the work is done, shut down the cluster, stop paying the hourly rate and take a snapshot of the system to cheap AWS S3 storage.   You can then restore that snapshot to a new cluster whenever you need it.

Is it the only option?  Certainly not, but it is fast, easy  to use and to scale out.  That may be hard to beat for my needs, but I will also be looking at some SQL on Hadoop options soon.


Friday, 28 March 2014

Back to blogging on "Better Business Analytics"

It's been quite a while, just over 12 months in fact since my last blog post.  In that time, I've been hard at work developing analytic applications for the Orchestro DSR.  (Orchestro's off-shelf alerting tool is especially cool and something I am very proud of contributing to).    I enjoyed my time at Orchestro, they're a good team and have big plans, but one key thing I found out about myself is that I prefer working real-life problems to developing software for someone else to have all the fun :-)

So, I'm now back full-time on consulting and I will occasionally blog on topics of interest to me.   Expect to see more soon on:

  • Next-generations DSRs (Demand Signal Repositories)
  • Retail supply-chain analytics
  • Handling (BIG-ish) data for analytics
  • The right tools for the job (Predictive Analytics, Business Models, Optimization)
  • Some more thoughts on store-clustering
  • Inventory modeling at retail (and why it's different, again)
  • Order forecasting using POS data
  • Further thoughts on SNAP and other ignored demand drivers
  • and if there is something you would like to hear more on ... just drop me a line.


Monday, 11 February 2013

The right tools for (structured) BIG DATA handling

Here's the scenario: you are a business analyst charged with providing reporting and basic analytics on more data than you know how to handle - and you need to do it without the combined resources of your IT department being placed at your disposal.  Sounds familiar?

Let's use Point of Sale data as an example as POS data can easily  generates more data-volume than the ERP system.  The data is simple and easily organized in conventional relational database tables -  you have a number of "facts" (sales-revenue, sales-units, inventory,  etc.) defined by product, store and day going back a few years and then some additional information about products, stores and time stored in master ("dimension") tables,

The problem is that you have thousands of stores, thousands of products and hundreds (if not thousands) of days - this can very quickly feel like "big data".    Use the right tools and my rough benchmarks suggests you can not only handle the data but see a huge increase in speed.


Let's see just how big this data could be:
If on each day, you collect 10 facts for 1,000 products at 1,000 stores that would be 10 million facts every day (10 x 1000 x 1000) .  Look at it annually , that's 3.65 billion facts every year.  
Is it big compared to an index of the world-wide-web? No it's tiny, but in comparison to the data a business analyst normally encounters it's not just "big" its "enormous".  Just handling basic data manipulation (joins, filters, aggregation etc,) is a problem.  Trying to handle this in desktop tools like Excel, or Access is completely impossible.

As usual, there are better tools and worse tools - you must use a database, but even with a conventional server-based database like Microsoft's SQL*Server, you may have problems with speed.   I wanted to see how speed is impacted, firstly by upgrading the hard-drive and second by using two varieties of column-store databases.  

A couple of relatively simple changes and bench-marking shows a 4100% increase in speed.  If a 4100% increase does not indicate to you that there may be a better tool for the job, I don't know what will.

Running analytics against this data (once delivered from a tool that has joined, filtered and aggregated) appropriately is another challenge that we will get to in a later post.

First a little disclosure: I am first and foremost an analyst: my technologies of choice are statistics, mathematics, data-mining, predictive-modeling, operations-research,... NOT databases and NOT hardware-engineering. To feed my need for data I have become adept in a number of programming languages and relational database systems. I'm most comfortable in SQL Server just because I'm more familiar with that tool though I have used other databases too. Bottom line, I'm a lot better than "competent" but I am not "expert".

Test environment

I built a test database in SQL Server 2012 with 4 tables in a simple "star schema": 1 "fact" table with 10 facts per record and 3 associated "dimension" tables as follows:


Inline image 1

The data itself is junk I generated randomly in SQLServer with appropriate keys and indexes defined.  

This represents approximately 8 GB of data.  Not enormous (and as you will see later) perhaps not big enough to test one of the options fully, but big enough to get started and much bigger than many analysts ever see.

I'm testing this on a mid-range laptop, quad-core AMD CPU, with 8 GB of RAM running Windows 7 (64 bit) that cost substantially less than $1000 new. You probably have something very like it sat on your desk.

I then wanted to see how long it would take to take to perform a simple aggregation. My test SQL (below) joins the fact table to both the product and period dimension tables then adds each fact (1 thru 10) for each year and brand. Not very exciting perhaps but a very common question "what did I sell by brand by year".

SELECT Item.Category, Period.Year, SUM(POSFacts.Fact1) AS Fact1, SUM(POSFacts.Fact2) AS Fact2, SUM(POSFacts.Fact3) AS Fact3, SUM(POSFacts.Fact4) AS Fact4, SUM(POSFacts.Fact5) AS Fact5, SUM(POSFacts.Fact6) AS Fact6, SUM(POSFacts.Fact7) AS Fact7, SUM(POSFacts.Fact8) AS Fact8, SUM(POSFacts.Fact9) AS Fact9, SUM(POSFacts.Fact10) AS Fact10 FROM Item INNER JOIN POSFacts ON Item.ItemID = POSFacts.ItemID INNER JOIN Period ON POSFacts.PeriodID = Period.PeriodID GROUP BY Item.Category, Period.Year

Each run was repeated 5 times and the elapsed time for each run averaged to get the results shown below.  While there was variation in run times, this was typically within about 10% of the average for each test.

Baseline

This is my starting point: SQL Server 2012 in its regular row storage mode.   


Faster Storage

This database query is going to need a lot of data from the hard-disk; actually almost all the data in the database.  The hard-drive that came with my laptop was not especially slow but it was clear that it was a bottleneck on my system.  While running this query the standard disk could not deliver data fast enough to keep the CPU busy - in fact the CPU was rarely operating at even 50% capacity.   An option to upgrade the hard-drive seemed to be in order.  ($350 for a 480 GB Solid State Disk).

SQL Server 2012 ColumnStore Indexes

SQL 2012 has a new feature called a Columnstore Index.  Per the Microsoft website:
 "An xVelocity memory optimized columnstore index, groups and stores data for each column and then joins all the columns to complete the whole index. This differs from traditional indexes which group and store data for each row and then join all the rows to complete the whole index. For some types of queries, the SQL Server query processor can take advantage of the columnstore layout to significantly improve query execution times... Columnstore indexes can transform the data warehousing experience for users by enabling faster performance for common data warehousing queries such as filtering, aggregating, grouping, and star-join queries."
To put that in plainer English - for data warehousing applications (like reporting and analytics) a columnar database structure can pull its data with fewer trips to the disk - and that's faster, potentially a LOT faster.  (By the way if you want your database to support a transactional system where you will repeatedly be hitting it with a handful of new records or record changes - this could be an excellent way to slow it down  )

Now adding a ColumnStoreIndex does take a while but it's not exactly difficult.  It's just a SQL statement that you run once:
CREATE NONCLUSTERED COLUMNSTORE INDEX [ColIndex_POSFacts] ON [dbo].[POSFacts] ([Fact1],[Fact2],[Fact3],[Fact4],[Fact5],[Fact6],[Fact7],[Fact8],[Fact9],[Fact10])WITH (DROP_EXISTING = OFF) ON [PRIMARY].
Note: Once the ColumnStoreIndex is applied the SQL Server table is effectively read-only unless you do some clever things with partitioning.  For one-off projects this doesn't matter at all of course.  For routine reporting projects you may need a DBA to help out.

InfiniDB columnar database

Columnar databases are not really "new" of course, just new to SQL Server so I also wanted to test against a "best of breed", purpose-built columnar database.  

Why Infinidb?  From my minimal research it seems to test very well against other columnar databases, it's open source (based on MySQL), will run on Windows and comes with a free community edition.  I actually found the learning curve relatively simple, in fact, as Infinidb handles it's own indexing needs it's perhaps even simpler than SQL Server .  Frankly, the hardest part was remembering how to export 40 million records neatly from SQL Server so they could easily be read into InfiniDB using their (very fast) data importer.

The Results

Here are the (average) elapsed times to run this query under each disk and database configuration.  


So the basic SQL Server 2012 configuration on a regular hard-drive took... 1,535 seconds to run my query.  That's over 25 minutes.  I can drink a lot of coffee in 25 minutes.

Upgrade to the Solid State Disk (SSD) and it runs 460% faster in 5 minutes and 32 seconds.  Now understand that my laptop does not use the fastest connection to this SSD, it's spec says it can handle 2.5 Gb per second.  I believe newer laptops run at 6 Gbps.  That being said at least now the quad-core CPU was being kept busy.

If instead of upgrading the disk we add a ColumnStoreIndex to the fact table, we do even better reducing from 1,535 seconds to 126 - that's over 1200% faster !

So which option should we use?   Both of course!  I can now run a query that used to take 25 minutes in 37 seconds.  That's 4100 % faster than when I started.

Now let's take a look at that InfiniDb number.  (I did not test with InfiniDB before swapping out the hard-drive so I only have data for it on the SSD.)   Surprisingly it was not quite as good as the SQL Server speed with the Columnstore Index .  I talked to the folks at Calpont that develop InfiniDB and they kindly explained that a key part of their optimization splits large chunks of data into smaller ones for processing.  Sadly my 41 million record table was not even big enough to be worth splitting into 2 "small" chunks so this particular feature never engaged in the test.  Still it's almost 3000% faster than base SQL even on this "small" dataset and the community edition is free.  

Based on the success of this test I think it's time to scale up the test data by a factor of 10 - watch this space.
(Check out the following update post for more details.)

Conclusions

My test-bed for this  benchmark was a mid-range laptop with a few nice extras  (more RAM, solid state disk and 64 bit OS) but certainly not an expensive piece of equipment and it managed to handle an enormous amount of data with very little effort.  This opens up possibilities for analyzing and reporting on much more data than was possible previously on your desk.

The implications are not just relevant to desktop tools though or to tools we think of as databases.  Numerous other tools now claim to handle data storage in columnar form (see Tableau and PowerPivot for Excel).

Is this the best tool for the job?  Perhaps, perhaps not: there is an enormous amount of activity and innovation in the database space right now and many. many other software providers.  It's certainly a lot faster for this specific purpose and a major step forward over more traditional approaches.

Look hard at columnar databases to speed up your raw data processing and don't spend any longer waiting on slow hard-drives.   

Monday, 4 February 2013

Business Analytics - The Right Tools For The Job

Whether your analytic tool of choice is Excel or R or Access or SQL Server or ... whatever,  if you've worked a reasonable range of analytic problems I will guarantee that at some point you have tried to make your preferred tool do a job it is not intended for or that it is ill-suited for.  The end result is an error-prone, maintenance nightmare and there is a better way.

We all know when we are pushing it too far - the system starts to "creak".  Symptoms vary but include at least some of the following:
  • Model calculations run slowly (if they complete at all).
  • Model calculations give, apparently, inconsistent results.
  • Making minor changes becomes a major headache
  • Errors ("bugs") are routine.  When you need to do a demo, you pray first.
  • You have learned to avoid certain operations because the likelihood of success is slim.
  • If you must come back to your model/application after 6 months to update it, you feel physically ill.
  • and perhaps most importantly, you are far from sure that using your model generates the right results.
This isn't just an academic issue or one of preference.  Poor models can cost real money in lost opportunity or bad decisions that get implemented.  (See this post for a few examples)

So why do we do this ?  I think it's because for many analysts their tool box looks like this.

Why is their toolbox so empty?  In some cases, corporate IT restrictions may make it very difficult to  acquire/install the right tools;  I've been there, it's a real challenge.

For many people though, it just feels easier to take a tool they know well and try and "make it work" than to learn something new.  That's rather like thinking  "I need to chop down a tree... I'll sharpen my hammer" 

Last week, I gave you my nominations for "The Worst use of Excel Ever!"  I could easily cite similar abuses for other tools and over the next few months I will.   

This blog post is the first in a series around using "The Right Tool For The Job".   I'm going to encourage you to add a few more tools to your analytic tool-box and learn to wield them effectively. (Or, alternatively, to at least recognize when you need someone who can do that for you.)  Do you need: 
  • A application programming environment ? 
  • A database (of varying capability, Access, SQL or perhaps a newer column storage databases) ?
  • A reporting tool ?
  • An optimization modeling language ?
  • A visualization tool ?
  • A statistics or data-mining package ?
  • A simulation package ?
Which tools do you think are the most mis-used?  What skills/tools should a business analyst consider adding to their toolbox ?  

Monday, 21 January 2013

Recommended Reading: Supply Chain Network Design


I've done a lot of  supply chain network design projects and consider myself to be an expert. Had I had this book from the start, I may have got to expert status a lot faster.

With experience in supply-chain and an academic background that includes mathematical-optimization, when the need arose to build supply chain network optimization models I just did it.  Then I learned many, valuable, real-world lessons the hard way- by getting it wrong.

There are a number of books available that cover this area: I have dipped into a few, as needed, and I have not read most of them so I really can't say this is the best book available on the subject.  I can say this is one of the very few analytic books on any subject that I have read cover to cover.  


Network design is perhaps not as hot a topic now as it was 10 years ago.  That's just my perception, but while the hype right now is around "big data", network design continues to deliver major savings to organizations.  Network design finds where your facilities should be and how product should flow through them to support your business at the lowest cost.  The more rapidly your business is changing the more often this is worthwhile: an acquisition or divestment will almost always justify the expense with a significant ROI.  A 10% reduction in supply chain cost is common..  Even on a stable business there can be significant saving (transportation, labor and warehousing) in adjusting product flow on a relatively frequent, annual basis.

Note that while the authors (all from IBM) have extensive experience building software products to help you do supply-chain network optimization this book is not a sales brochure for LogicNet, in fact, it's barely mentioned.

The math needed to run an optimization model is not simple but it is accessible to those who want to learn and this book does take you through step by step a mathematical programming model that gets increasingly sophisticated.  The necessary theory is all there.

What attracted me was that it goes beyond the theory and has lots of details around project execution:.  the need for sensitivity analysis; the difficulty of getting reliable transportation rates ; sensible data aggregation strategies; why you must have an optimized "baseline"; and numerous others.  These are all areas that analysts get wrong - as I did.  Some learn from the experience, others send out the results anyway.

Managers who hope to become better buyers/consumers of network-design projects (remembering that  your analysts may also be making newbie mistakes) skip the math sections and you can still understand what can be modeled and why you would want to.

For analysts actively involved in building optimization-models the mathematical formulations are extremely helpful. Even if you choose to build models with a software package that tries to hide the harder math from you, the guidance around data and the art of modeling is worth the price and the time to read it.

If you have a network design project in mind and a plane journey coming up - make the investment.  

Supply Chain Network Design: Applying Optimization and Analytics to the Global Supply Chain (FT Press Operations Management) by Michael Watson, Sara Lewis, Peter Cacioppi and Jay Jayaraman (Sep 1, 20112)


Monday, 14 January 2013

Ignore SNAP and your product may not be on the shelf when it's most needed - and that means lost sales.


SNAP is the “Supplemental Nutrition Assistance Program” (formerly known as “Food Stamps”) in the United States which puts food on the table for 46 million people every month. 

SNAP can drive big spikes in sales at the store. These spikes are large but short-lived and often pass undetected by reporting and forecasting systems.    

Our whitepaper covers the causes of SNAP spikes, why they vary so much across regions and products, how to identify sales spikes and what you should be doing to maximize sales.

Download it now or visit our website for more information.


Monday, 19 November 2012

SNAP Analytics (2) - Purchase Patterns

Roughly 15% of the United States population receives SNAP funding to help pay for food and beverage items.  We know that when SNAP (food stamp) funding is released in each state (see SNAP Analytics (1) - Funding and spikes)  this is accompanied by significant sales spikes on some products,

If 15% of all shoppers visit your store within a 2-3 day period you should see a sales spike on  everything they buy, SNAP funded or not . So, why do we not see a spike on everything?  Why are some spikes so much bigger than others?


The chart below shows (simulated) daily point of sales data for a SNAP-responsive product in one state.  The horizontal axis shows days of the month, the vertical shows a sales 'Index' relative to the average day.  You can see that sales around the 1st and 10th of the month are roughly double what they are on other days.


If you also know that this state releases SNAP funding on the 1st and 10th of each month, you might assume that the SNAP shopper takes their newly-charged EBT card and within 2-3 days spends the lot.

A relatively high proportion of SNAP funding is spent quickly and this ties well with the idea of a "stock-up" trip.  (If you have the capability to see basket size by date, you should be able to confirm that baskets around SNAP release dates are substantially larger than otherwise.)

So why do I think that this does not represent all SNAP spending?  
Some products are just not good candidates for a once-a-month stock-up trip.  Milk for a month?  I don't think so.  Bananas seem to go soft in my house if I forget them for 1-2 days.  A month's supply of a product may take up more room that I have available in the cart, car,  refrigerator, freezer, or store cupboard.  Some of this will have to wait. 
Some products are more attractive for stock-up trips: larger sizes of frequently consumed products that are stable (on shelf, in fridge or freezer) and perhaps also with "treats" that can be purchased while there is a little extra money available.
According to the USDA, in 2011,  the average monthly SNAP benefit per household was  $284.   Remember that this is $284 spent on SNAP eligible products only:  leave out  non-food/beverage items, hot foods, ready-to-eat items, alcohol and tobacco.  Can it be done?  Yes, but its going to be tough to fit into one shopping cart or in your car or in your kitchen.   $284 is the monthly benefit for the average household of 2.1 people.  Could a family of 4 realistically buy even most of their food once a month?  Even if the SNAP shopper could buy all their food and beverage  items in one trip, they still need other grocery items, paper goods, cleaning products etc. that takes up additional space. 
Finally, the  countrywide adoption of EBT cards, rather than paper vouchers, means the SNAP shopper can spend as little as they need right now without losing any of their benefits.  (Something the similar WIC program is still working on in most states).
Despite the big spikes in sales we see for some products around SNAP funding dates, the SNAP shopper is not buying all their monthly supplies in one trip.   Some products will be much more responsive to SNAP funding than others because they fit well with the SNAP shopper's trip-type and taste preferences.

So, how do you know if your products are responsive to SNAP funding dates?    If you have access to the payment details by basket it's a slightly simpler process of querying your data and correlating across to SNAP release dates.  If you have daily point of sale data you need to build predictive models against total sales rather than SNAP specific sales (Do you need daily Point of Sale data?).  In either case, you are dealing with very large quantities of data and need the right tools and the knowledge to wield them effectively (Bringing your analytical guns to bear on Big DataData handling - the right tool for the job).

If you do not know which products, stores and dates will see spikes in demand how can you ensure product is on-shelf?  Ignoring SNAP may be costing you sales.

If you're ready to get started - call me.


Monday, 12 November 2012

SNAP Analytics (1) - Funding and spikes.

Back in August I took a quick look at SNAP, the US government's "Supplemental Nutritional Assistance Program", formerly known as "Food Stamps". (see What's driving your Sales? SNAP?).  

In 2011, approximately 15% of the US population received SNAP benefits that they can spend on most food and beverage items in store.  SNAP funding has doubled in the last 3 years.

SNAP can create large spikes in demand at the store and yet, because of the way these funds are distributed , this is typically hidden from analysts looking at aggregate data. (see Do you need daily Point of Sale data?... )

If you do not know which products, stores and dates will see spikes in demand how can you ensure product is on-shelf?  Ignoring SNAP may be costing you sales.

This is the first in a series of posts covering Analytics around SNAP and opportunities for driving incremental sales.

The table below shows the days of the month (highlighted in red) when each state distributes SNAP funding (click on it to enlarge):

US SNAP funding patterns by state and day of the month.


At the top of the table, we have the States that distribute all their funding on just 1 day of the month. Out of the 54 States, Districts and Territories shown just 10 of these distribute on one day and (thankfully) they are not the ones with the biggest sales. But, if you are selling a SNAP responsive product you will want to ensure you plenty of stock in-store and on-shelf on the first for these states. 

The States are ranked in terms of the impact SNAP distribution is likely to have within each state: the size of the sales "spike". Fewer SNAP distribution days and the spike will be higher. Perhaps less easy to explain but the closer that SNAP distribution days are to each other, the more their shoppers overlap in store and the higher the sales spike. Consequently, Utah with 3 dispersed distribution days may have slightly lower sales "spikes" than New Jersey with 5 distribution days in a single block.

Somewhere along the line between Nevada (ranked #1) and Missouri (ranked #54) SNAP stops mattering to you because the distribution of fund is so dispersed through the month that you see no sales spikes at all.

74% of funding is distributed on 10 days or less and 10 day distribution can still generate, on average, a 20%-40% increase in sales $$. BUT, some products are more responsive to SNAP distribution than others; some stores will have many more than the average 15% of their shoppers eligible for SNAP. So, within the same State expect huge variations in the size of demand spikes. It may not be the average that's causing a problem.

Do you know which products, stores and dates are at risk? If not, how do you know how much demand went unfulfilled?  


Wednesday, 7 November 2012

What's the biggest supply chain issue for CPG/Retail?

This morning I picked up a post for this blog from Visicom.  In summary
"We asked dozens of retail store managers this week: what’s the biggest issue you are having with product delivery by vendors? Know what they said? The biggest problem for most retailers is out of stock products."
Despite the low, probably unrepresentative sample size (dozens?) I think there is a ring of truth to this, but, is product delivery the biggest supply chain issue for CPG/Retail?  Not even close.


Of course it's a problem if a vendor cannot deliver the goods, particularly if this is to support promotional activity.  A more flexible and responsive supply chain can reduce this problem and it's a worthy goal to improve that capability.

But, the biggest issue with the supply chain is still the replenishment of the shelf from inventory that the store already has.   The one moment of truth that matters is when a shopper is looking for a product: is it there on the shelf?  With store systems typically reporting that they have sufficient inventory to support sales ~99% of the time, why do one-off reports repeatedly show that on-shelf presence is closer to 90% ?

Part of the problem is that measuring on-shelf presence is relatively difficult and expensive because you can't rely on the stores systems to tell you the answer:
A large part of the problem is to do with so called "phantom inventory".  Phantom inventory that appears to be at the store but in reality has been lost to theft, unrecorded damage, sales recorded as another product or perhaps it is literally "lost": it's in the store but if neither you nor the customer can find it, it's as good as useless. 
Whether or not product is on-shelf can also change (easily) within the day.  Measure it late at night after much re-stocking has been done and it may look a lot better than it does at 6:30 pm on a Friday night. 
Even if product is on a shelf, it may not be on the right one or it's effectively removed from sale by having other product placed in front of it, or being out of reach (like individual cans of cat-food at the back of a 4' deep "warehouse" shelf.)  
So, it's difficult to get good numbers of how bad the problem really is but ~90% on-shelf presence seems to be a reasonable estimate.   This ties with my own experience and is born out repeatedly in ad-hoc studies.

A number of companies (RSi, TR3, TrueDemand - now owned by Acosta) have built business on systems that monitor point of sale data and flag to the Retailer/CPG which products appear to be off-shelf at any point so they can rush someone in to fix the problem: find lost inventory, identify phantom inventory, replace lost shelf-tags or just re-organize the shelf so there is room to replenish a product where it is supposed to be on the planogram.   This too is a good idea, but it will never pick up all off-shelf  issues: they require at least multiple days of zero-sales if not weeks to be effectively picked up.

A CPG may feel that this issue is entirely within the store's control but I'm not so sure.   It seem to me that there are any number of things that a CPG could do to make it easier for a retailer to stock shelves effectively.  Here are some hypotheses that I think would be worth testing::

  • It's  easier to stock products that fit easily on the shelf: pack-size v.s shelf-space could play a big role.
  • 5lb cases get re-stocked more effectively than 45lb cases
  • products that are easy to identify in back-room storage are re-stocked more effectively
  • whole cases are re-stocked more effectively than cases that must be broken open.
  • some shelving fixtures see more off-shelf issues than others
  • some package-forms see more off-shelf issues
  • some departments routinely have more off-shelf
  • planograms are set based on "average" volume but off-shelf issues are driven by peaks in demand (see Do you need daily Point of Sale data?)
Is this the right list?  Probably not: it's certainly incomplete and we would probably find not all of these matter  much to the outcome, but, I do think it's the right approach.  With an appropriate sampling scheme to measure on-shelf presence and some predictive-analytics  we could find (and quantify) what really drives this problem then work to eradicate the root causes to get substantial improvements.

How does 2%-3% more revenue sound to you?  It may not seem like a lot but with typical logistics costs  representing 5%-10% of CPG sales a 3% increase in revenue may well be the biggest thing supply-chain can do to improve the bottom line.

What do you think drives or prevents excessive off-shelf issues?   Or do you think I'm missing the point and there is a bigger issue to be found?  Let me know in the comments section below.

Monday, 29 October 2012

Truckload Transportation - are you paying to ship air ?


How full is a "full" truck?   Not sure?  That's a shame, because when you contract for truckload freight, you pay for the whole vehicle, whether you fill it or not.   As I'll show you, the regulations around what constitutes "full" for weight are very complex.  In addition, the 3D jigsaw puzzle to pack product into the trailer space, distributing weight correctly and minimizing damage is exceptionally challenging.  Get it wrong and you are paying to ship air.  

It is much easier to plan to approximate rules or guidelines than to figure out what's really going on and it is common in the CPG industry to plan transportation loads based on these approximate rules.   Unfortunately, these approximate rules are very dependent on what you are trying to load (as well as who made up the "rule") so you will rarely encounter the same "rule" twice.  Typically what you will see is based on weight, pallet positions or cube.  Rules that restrict what's loaded to maximum limits like:

  • 40,000 lbs of product
  • 2,500 cubic ft of product
  • 48 pallets of product.
None of these are right and they routinely result in shipping air.

Depending on the product and the vehicle,  I can safely, and legally, load much more than 40,000 lbs of product, (much) more than 2,500 cubic feet many more than 48 pallets.  

One particularly bad example I have encountered said "a truck is full when there is 38,000 lbs of product in it".  If I can find a way to, legally and safely load 45,000 lbs in the trailer it’s as though 7,000 lbs of product just shipped free, effectively saving 15% ((7,000/45,000 = 15.5%) in freight cost.

So, why is this so difficult to get right?  Let's look at the regulations around weight.


Weight Limits

If your product is "heavy", you will probably hit a weight limit in loading.  "Heavy" in this instance is roughly 20 lbs per cubic foot or more.  Much less than this and you will probably hit a space limit first (see below).

The government sensibly places restrictions on how heavy a loaded vehicle may be and how that weight must be distributed to be carried safely.   To get a feel for  the complexity involved, here is a link to the relevant page from the US Department of Transportation.  Stay just long enough to get confused then head back here :-)   Bridge Formula Weights 

To summarize (and simplify):
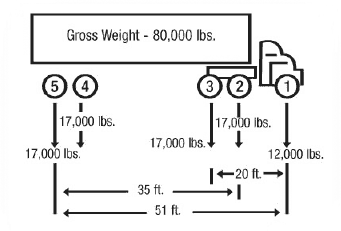
  • The  total weight of the vehicle (including product, packaging, pallets, fuel, driver, etc...) must not exceed 80,000 lbs.
  • There are limits for the weight on individual axles (shown below in this graphic from the US Department of Transport)
Note for the mathematically inclined:
If anyone is really interested in being able to calculate what weight should be on each axle given a particular layout of product in the trailer you need a little physics/engineering math.  Here is a great example of how a beam transfers load with an interactive calculator.
With the right math, you can calculate the center of gravity for the product and how that weight would be distributed to the axles.  Move the center of gravity forwards (e.g. by moving heavier product to the front) and you take weight of the rear wheels and transfer it to the tractor unit.  Quite how that weight then gets distributed to to axles 1 through 3 depends on where the "kingpin" connection (between the trailer and the tractor unit) is relative to the tractor units axles. You can build such a model in Excel.
So, can you plan to a total rig weight of 80,000 lbs?  No, sorry,  there are only so many options for how to layout product in the vehicle and there may be no layout that balances weight well enough across all axles to max out the 80,000 lb overall limit.You need to find the layout that gets closest to that limit and live with the loss.

Alternatively, you may run out of space in the vehicle before you get close to a weight limit.

Space Limits

If product is reasonably light (low density) we will probably be constrained by space before weight becomes a problem..

A reasonably standard trailer's internal dimensions are approximately
  • 52' long
  • 8' wide
  • 8' (usable) height
That's a little over 3,300 cubic ft of space available to you.  However, you are typically loading with palletized product and you will not get to use most of this space.   Let's look at how well you can use the floor space first.


A standard pallet for US grocery is 40" wide, 48" long. The ability to fill the trailer floor-space depends a lot on how well these palletized units fit.  


If pallets will fit in the trailer "wide:wide" it's possible to put 30 pallet footprints in a 53' trailer.


 If  the trailer is too narrow or product overhangs the pallet, you have to go to other configurations.   "Chimney stacking" maxes out at 28 footprints.  


If you can't turn pallets at all, "narrow:narrow" loads max out at 26 footprints (although with any overhang on the pallets at all you will likely get 24/25)


In each case there is floor space you cannot use.  Load "narrow:narrow" and you have already lost almost 20% of the available space.


Now let's look at vertical space.  This is much more variation in the height of trailers and in the height of doors to those trailers.  If the door height is restrictive , perhaps because the door rolls up inside the trailer, that will limit the product you can get into that trailer.  Let's assume for now that we can safely get to 8' high. 

How much of the vertical space we can use depends on what we are loading.  Some product cannot be stacked, pallet on pallet, without causing damage.  Some pallets are too tall to allow anything (except an unusually short pallet) to fit stacked on top of it.  Very short pallets may be able to stack 3 or even 4 high.

If I assume 40" high palletized product, double stacked, we can use 80" of the 96" vertical space (83%).
Combine that with "narrow:narrow" loading and we max out a truck at 83% * 83% = 69% space utilization. From a "cube" standpoint the trailer is only 70% full and it's at capacity.  Hence rules like "the trailer is full at 2,300 cubic feet of product" when the trailer has over 3,300 cubic feet of air.

Depending on product dimensions and the ability to stack product we may be able to load much more than 2,300 cubic feet or much less.

Reducing Damage

We could spend a lot of time on this, but for now suffice to say, we would like to load the trailer so that product is less likely to get crushed, to move as the vehicle corners or to land in a heap at the front when the driver must, necessarily, brake.  This puts additional constraints on what product can go where in the vehicle, reducing, again, the weight you can carry and/or the volume you can load into the available space.

Equipment  limitations

If the pallet handling equipment (for either shipper or receiver) can't stack pallets or can't handle them turned, you will necessarily lose a lot of payload capacity.  Unless this is for very short trips where you can pay for the freight-cost with handling labor savings, you need to invest in warehouse equipment.

Not all trucks/trailers are the same.  By design they can be very different, tractor units weighing anywhere between 11,000 and 20,000  lbs.  Trailers can be vary by a few thousand lbs too.  Even equipment of the same make, model and year can be different depending on its setup (kingpin position) and the addition of aftermarket parts.  (Mount a new fuel tank too near the front and see it use up the limited capacity you have on the steering axle).  If weight is an issue for you, you will need to work with your carriers to understand what equipment they are bringing in.  Lightweight equipment is worth more to you, heavyweight equipment should be avoided or contracted at a low enough rate to offset the loss in carrying capacity..

Pulling it all together

Each of these sets of restrictions, weight, space, damage and equipment are complex: accurately modeling any of them is a challenge.  Depending on what you load: heavy or light product, slightly oversize, stack-able or not,  the factors that constrain you continually move.  And, beyond modeling it, you need to optimize: to find the selection and layout of product that maximizes your vehicle loading.

My Take

If you're lucky enough to have consistently-sized, palletized product with consistent low or high density that is consistently  stacked and loaded on consistent carrier equipment  you may be able to build a simple rule that really does max out your truck loading.  Good for you!   For the rest of us, such "rules" are poor guesses at best and can leave a lot of money on the table.  

You are NOT going to build this in Excel unless you have a lot of functional knowledge, very advanced skills in mathematical-optimization and the ability to program your own optimization code.  I have built a load optimization tool (It's a weakness, I like to know how things work).  I have also built my own tools for inventory-optimization, neural-network modeling, genetic-optimization, forecasting and many other needs..  Some of these tools are still in production use today, others were essentially learning opportunities.  In this instance, I chose to buy the software because it has richer functionality than what I chose to build myself.

(On a technical note, application-specific,heuristic optimization routines solve these problems well and quickly.  Mixed-Integer-Programming can get you most of the way, but personally I can't see how to embed some of the damage-reduction ideas into a linear objective function and as the heuristic works so well, you don't need the overhead or complexity of integrating a math programming tool) 

Any load building “optimizer” that asks you to specify a maximum weight or cube or number of pallets is really just automating these approximate rules rather than helping you truly max out the load.  An optimizer that is implemented as a stand-alone package is interesting but not really useful: you need this capability integrated into order-processing, deployment and transportation planning to be effective.  You need the right tool for the job.  These tools do exist, they work and it's not worth your time or effort to write them again.

There are a number of tools in the market that work in this space.  Google "load building optimizer" to see some.  I have not reviewed them all, far from it, but I can tell you that not all "optimization" is the same.  Having "optimize" in the sales literature does not mean it will do a great job for you or that any actual optimization is really taking place.

If you want a quick recommendation I suggest you talk to Transportation | Warehouse Optimization. they have a great load building tool and can extend this further into optimizing case-pick routing, pallet builds and shipping locations.

Let's assume you are doing a reasonably good job today without a load optimizer.  What would an extra 5% off your freight spend be worth to you?  Enough to invest in the right tool for the job?

A final thought

These rules-of-thumb can be very persistent.  Having implemented a system to drive increased payload coming out of one manufacturing site, I was perplexed some months later to see that the load factor had shrunk back to where it started.  It turns out that the warehouse supervisor at the plant was adjusting each and every load plan manually to fit with his interpretation of the “rules”.